Full Report
The Price-Taker
Alcoa Corporation makes a metal it cannot price. It mines bauxite, refines that ore into alumina, and smelts alumina into primary aluminum — the raw ingot that fabricators elsewhere turn into car panels, cans, and window frames. What it does not do is set what any of that is worth. Aluminum trades on the London Metal Exchange and is priced daily; alumina is sold against a published index; and the extra a US buyer pays to take metal on the ground in Ohio rather than in Rotterdam is a regional premium fixed by trade policy, not by Alcoa [1] [2]. The company is, in the plainest sense, a price-taker: its revenue is three external numbers multiplied by the tonnes it ships, and its profit is those numbers minus a cost base it can grind down but never escape.
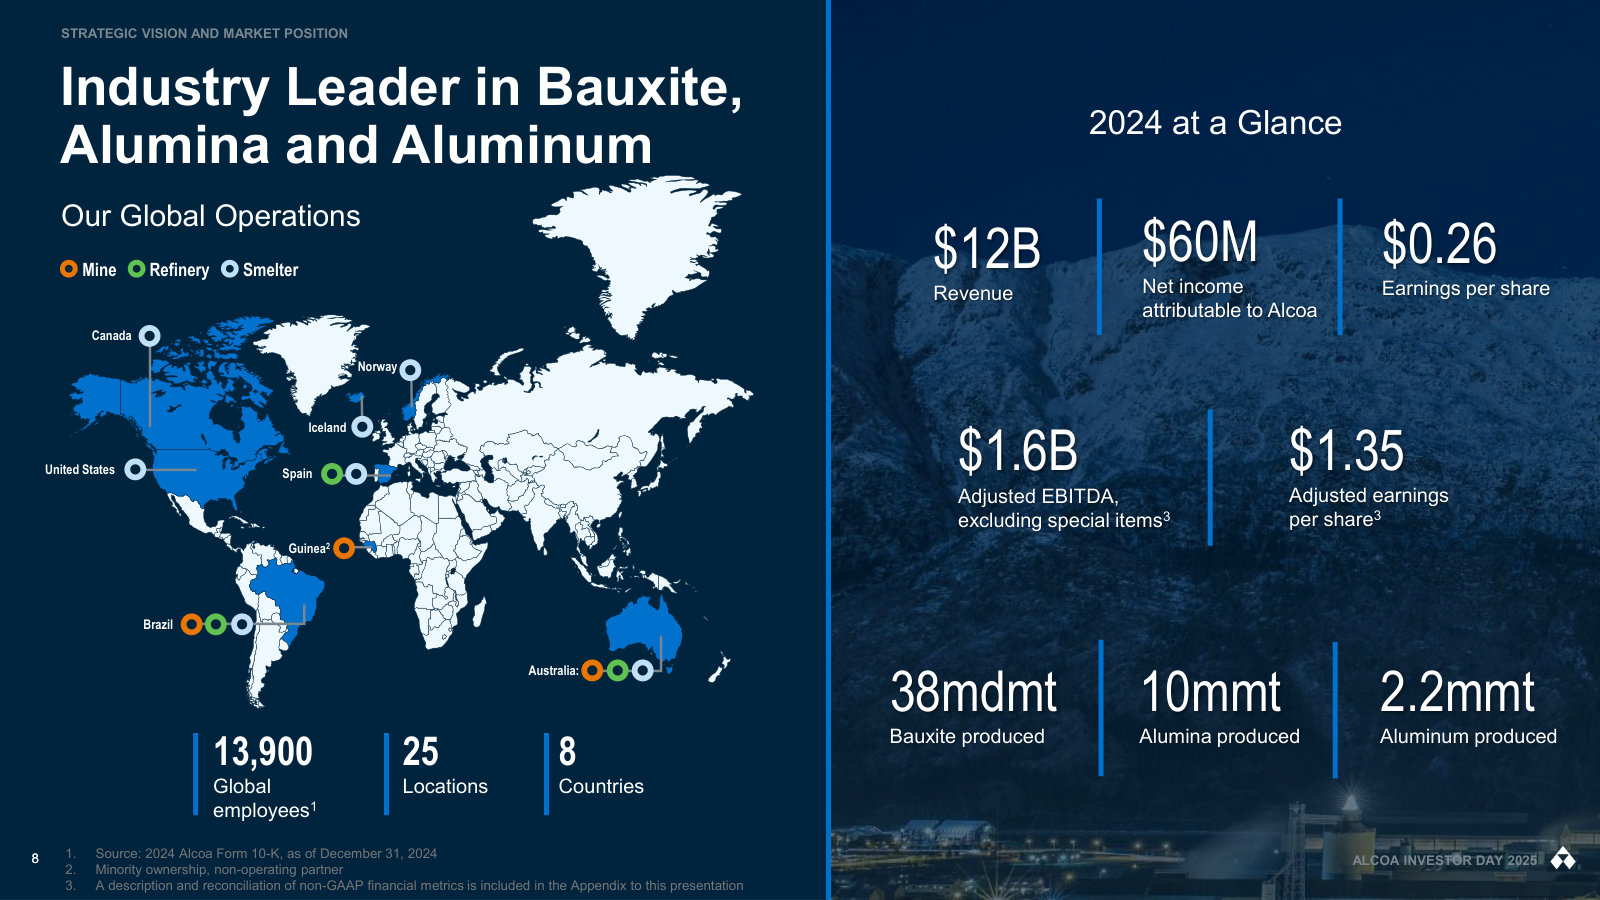
That purity is a deliberate inheritance. On November 1, 2016, the old Alcoa split in two — the value-added downstream business (rolled sheet, aerospace parts) left as Arconic, and the upstream mining-and-smelting half kept the Alcoa name [3]. What remains is a vertically integrated commodity producer across 25 sites in eight countries, run as exactly two reportable segments — Alumina (bauxite and refining) and Aluminum (smelting, casting, and most of the power assets) — with no downstream cushion to absorb a swing in market prices [4]. In 2025 it turned $12.8 billion of sales into $1,940 million of Segment Adjusted EBITDA, split $882 million from Alumina and $1,058 million from Aluminum [5] [6].
This report reads Alcoa as what its own filings describe: a pure-play upstream aluminum price-taker whose entire result is set by two external commodity curves and a US Section 232-inflated Midwest premium it does not control, sitting 46% below its high at a low forward multiple that embeds a doubling of premium-driven EBITDA. It is run by a credible operator that keeps its cost and balance-sheet promises but has funded serial acquisitions with roughly 46% two-year dilution while quietly shelving the shareholder returns it announced at the last peak. This chapter builds the machine — the three prices, the thin spread, and the two-speed cycle. The chapters that follow test the cost edge that spread depends on (Cost Is the Only Moat), the ledger of how the company was paid for (The Operator's Word), and what today's price is quietly assuming (What the Price Assumes).
Three prices set the top line
For a price-taker, revenue is almost the whole story. A tonne of Alcoa's primary aluminum sells for three stacked components, and the 10-K names them in order: "(i) the published LME aluminum price for commodity grade P1020 aluminum, (ii) the published regional premium applicable to the delivery locale, and (iii) a negotiated product premium that accounts for factors such as shape and alloy" [7]. The base is the LME — the global exchange price, which Alcoa realizes on a roughly 15-day lag and which averaged $2,614 per tonne in 2025 [8]. On top sits the regional premium — in the United States, the Midwest premium — which compensates for physically delivering metal into a particular market. Last is a small product premium for a specific shape or alloy. Stacked together, those components put Alcoa's realized aluminum price at $3,376 per tonne in 2025 — the $2,614 LME base plus $762 of premiums layered above it [9] [10].
Source: FY2025 Annual Report (Form 10-K), MD&A — realized price ($3,376 in 2025, $2,841 in 2024) and LME 15-day-lag average ($2,614, $2,409); premiums are the residual [11] [12].
The premium layer nearly doubled in a single year — from $432 to $762 per tonne — and that jump, not a move in the underlying metal, is where trade policy enters the income statement. It is taken up under "why now" below. The alumina leg works the same way with one input: alumina is priced off the Alumina Price Index (API), a weighted average Alcoa calculates from three published spot indices, and it realized $415 per tonne in 2025 [13] [14].
None of this is Alcoa's peculiarity; it is the structure of the whole upstream industry. Century Aluminum, a US pure-play smelter, describes the identical three-component price to its own shareholders and states the position bluntly: "Our operating results depend on the market for primary aluminum which can be volatile and subject to many factors beyond our control" [15]. Producers here do not compete on price — they all sell into the same exchange. They compete on cost. That is why the spread, not the price, is the figure that matters most.
A thin spread, heavily levered
Alcoa keeps very little of each sales dollar as gross margin, and that thinness is the source of its violence. In 2025, cost of goods sold was $10,658 million against $12,831 million of sales — 83% of revenue, leaving a gross margin near 17%; selling and administrative expense was a rounding error at roughly 2% of sales [16]. When cost sits that close to price, a few-percent move in either one swings operating profit by hundreds of millions. The economics resolve to a per-tonne spread — realized price minus operating cost — that the segment note discloses directly for each leg.
Source: derived from FY2025 Annual Report (Form 10-K) segment notes — Aluminum $3,376/$2,600 (2025) and $2,841/$2,410 (2024); Alumina $415/$317 and $472/$309 [17] [18].
The aluminum bars carry the point: the spread widened from $431 to $776 a tonne in one year — a $345-per-tonne gain on roughly 2.3 million tonnes of production. That is the operating leverage, and it explains why physical output barely matters to the result. Aluminum production was 2,319 thousand tonnes in 2025 versus 2,215 the year before, and alumina production actually fell, to 9,640 thousand tonnes from 10,034 — small moves [19] [20]. Yet total Segment Adjusted EBITDA has swung from $2,280 million in 2022 down to $734 million in the 2023 trough and back to $1,940 million in 2025 — a three-fold range on nearly flat tonnes [21] [22]. The same leverage runs straight through to cash: cash provided from operations nearly doubled to $1,185 million in 2025 from $622 million a year earlier, so that free cash flow — operating cash flow less capital expenditure — swung from negative $440 million in the 2023 trough to positive $567 million in 2025 [23].
Source: FY2023 Annual Report (Form 10-K) segment reconciliation (FY2021–FY2023) and FY2025 Annual Report (Form 10-K) segment information (FY2024–FY2025) [24] [25].
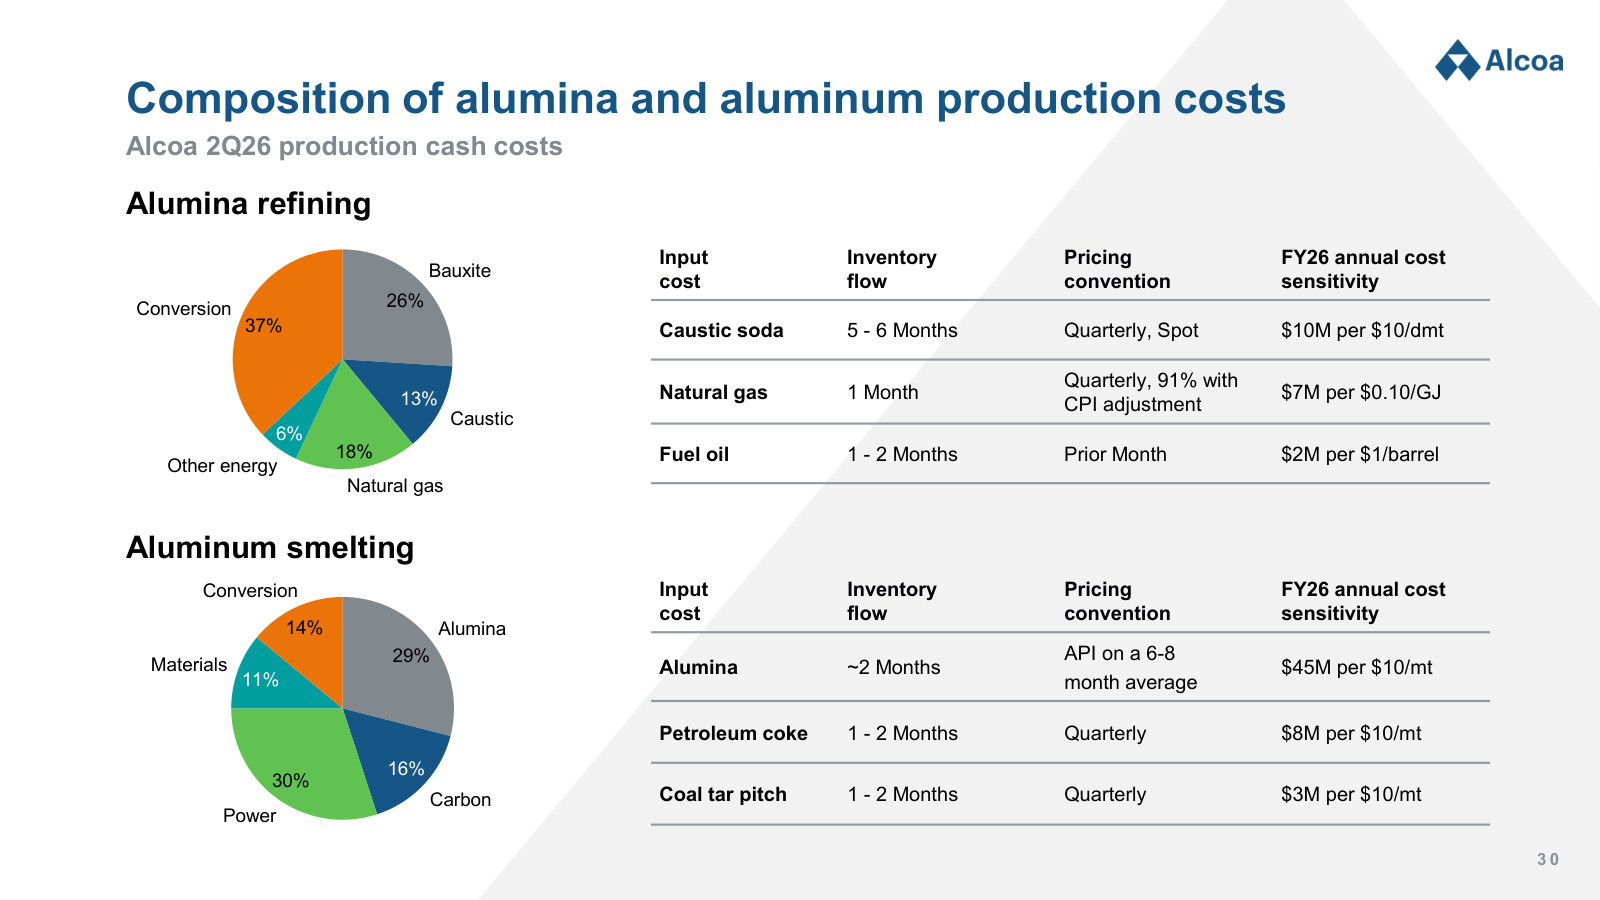
The cost side of the spread is not a single number but a short list of commodity inputs, and Alcoa discloses their weights. In alumina refining, the cash cost is roughly a quarter bauxite, a third conversion (labor and plant), and the balance energy and caustic soda. In aluminum smelting, the alumina intermediate is the single largest line at about a third, followed by power and carbon.
Alumina refining cash cost
Aluminum smelting cash cost
Source: Alcoa investor overview, March 2026, composition of 4Q25 production cash costs [26].
Two features of that list carry through the rest of the report. First, energy — natural gas and other power in refining, electric power in smelting — is a dominant, differentiating cost, and where a producer buys its power decides whether it survives a downcycle; that is the cost edge examined in the next chapter. Second, alumina is both a product Alcoa sells and, at roughly a third of smelting cost, the largest input it feeds to itself — which is why the two segments cannot be read in isolation.
Two segments, two cycles
Because alumina is the aluminum segment's biggest raw material, a fall in the alumina price does two opposite things to Alcoa at once: it guts the Alumina segment's revenue and, in the same breath, cheapens the Aluminum segment's cost base. In 2025 both happened, and the two segments moved in opposite directions inside a single year.
Source: FY2025 Annual Report (Form 10-K), segment notes — Alumina and Aluminum Segment Adjusted EBITDA, FY2024 and FY2025 [27] [28].
The Alumina segment's EBITDA fell $526 million as the API dropped and alumina slid into a global surplus, driven by refinery expansions in China and Indonesia after prices had touched an all-time high in the fourth quarter of 2024 [29] [30]. The Aluminum segment's EBITDA rose $401 million over the same span, lifted by a 9% higher aluminum price and helped by the very same cheaper alumina flowing into its costs, while metal itself stayed in deficit on historically low inventories [31] [32]. A refining glut and a metal shortage coexisted. The practical consequence: "the aluminum cycle" is not one number for this company — the vertical chain both amplifies consolidated swings and partly hedges them from the inside, and a single-segment read is misleading in either direction.
The surplus left a mark on the balance sheet as well as the income statement. In the fourth quarter of 2025, Alcoa wrote the Alumina reporting unit's goodwill down to zero, "a charge of $144 in Impairment of goodwill," driven by declining alumina prices and rising Australian mine costs [33]. The durability of Alcoa's cost position on that leg — where the write-down points — is the subject of the next chapter.
Why now
Alcoa is in front of investors today for three dated reasons, all of which flow from the machine above.
The first is policy. In 2025 the US moved its Section 232 tariff on Canadian aluminum from an exempt 10% to 25% on March 12 and to 50% on June 4 [34]. That tariff cuts both ways for Alcoa. It lifts the Midwest premium — up 211% year over year — which is the layer that took Alcoa's realized aluminum price from $2,841 to $3,376 a tonne, so a US-sited producer benefits [35]. But Alcoa also ships large volumes of Canadian-made metal into the US and pays the tariff on it: total Section 232 tariff costs were $571 million in 2025, which management says the elevated premium currently covers [36] [37]. The premium is a benefit and the tariff a cost, and the net is roughly a wash only while both hold — a two-sided dependence, not a one-way windfall.
The second is a second policy layer taking effect now. The EU's Carbon Border Adjustment Mechanism — a levy on carbon-intensive imports that has applied to aluminum in a transitional phase since October 2023 — moves into fuller force, repricing metal by its carbon content in Alcoa's European markets [38]. How much that is worth, and to whom, belongs with the cost-and-carbon discussion that follows.
The third is the tape. Alcoa trades around an $11.8 billion market value, roughly 46% below its three-year high — a deeper drawdown than the aluminum group as a whole — even as consensus looks for double-digit revenue growth ahead. What that price is underwriting, and why a headline year of record statutory earnings should not be taken at face value, is the closing chapter's work (What the Price Assumes).
For now, the machine is the point. Three prices Alcoa does not set — LME, API, and a tariff-driven Midwest premium — multiplied by tonnes it can barely move, minus a cost base built of energy, bauxite, alumina, caustic, and carbon, produce a per-tonne spread thin enough that a modest price move is a swing of hundreds of millions, and a chain integrated enough that its two halves can pull against each other in the same year. Everything that follows — the cost edge that defends the spread, the capital that was spent reshaping the company, and the price the market now puts on it — is built on that structure.
The Cost Curve
A producer that cannot set its price competes on one thing: what it costs to make a tonne. The previous act (The Price-Taker) left Alcoa as a thin per-tonne spread — three prices it does not control, minus a cost base built of energy, bauxite, alumina, caustic, and carbon. The prices are common to everyone in the industry; every upstream producer sells the same metal into the same exchange. So the only place a durable advantage can live is the cost side of that spread. This chapter tests how firm Alcoa's claim to a low cost base actually is.
The industry has a single word for that claim: the cost curve. Rank every refinery or smelter in the world from cheapest to most expensive and lay them left to right, and the result is a curve; where a producer sits on it decides whether it earns money at the bottom of the price cycle or bleeds until it idles. First-quartile assets — the cheapest 25% — make money almost all the time. Fourth-quartile assets are the marginal tonnes that shut first when prices fall. Norsk Hydro, an integrated peer, frames its own economics exactly this way, tying its exposure to "the factors driving the cost curve at the relevant pricing percentile" [1]. For a price-taker, cost-curve position is not one advantage among several. It is the advantage.
My read, stated once and then evidenced below: Alcoa's cost edge is real and genuinely rank-leading in alumina, but it is a moving industrial position rather than a fixture — management itself flags a slip toward the second quartile, the permit that would arrest that slip keeps slipping, and the edge is being widened by buying competitors rather than by a self-generated operating lead. The strongest fact for the bull case is that the number is externally verified and top-of-industry today; the strongest fact against is that the same disclosure warns it may not stay there. What would move the read is where the Australian mine approvals land and whether the alumina cost position holds its first quartile.
Where the edge comes from
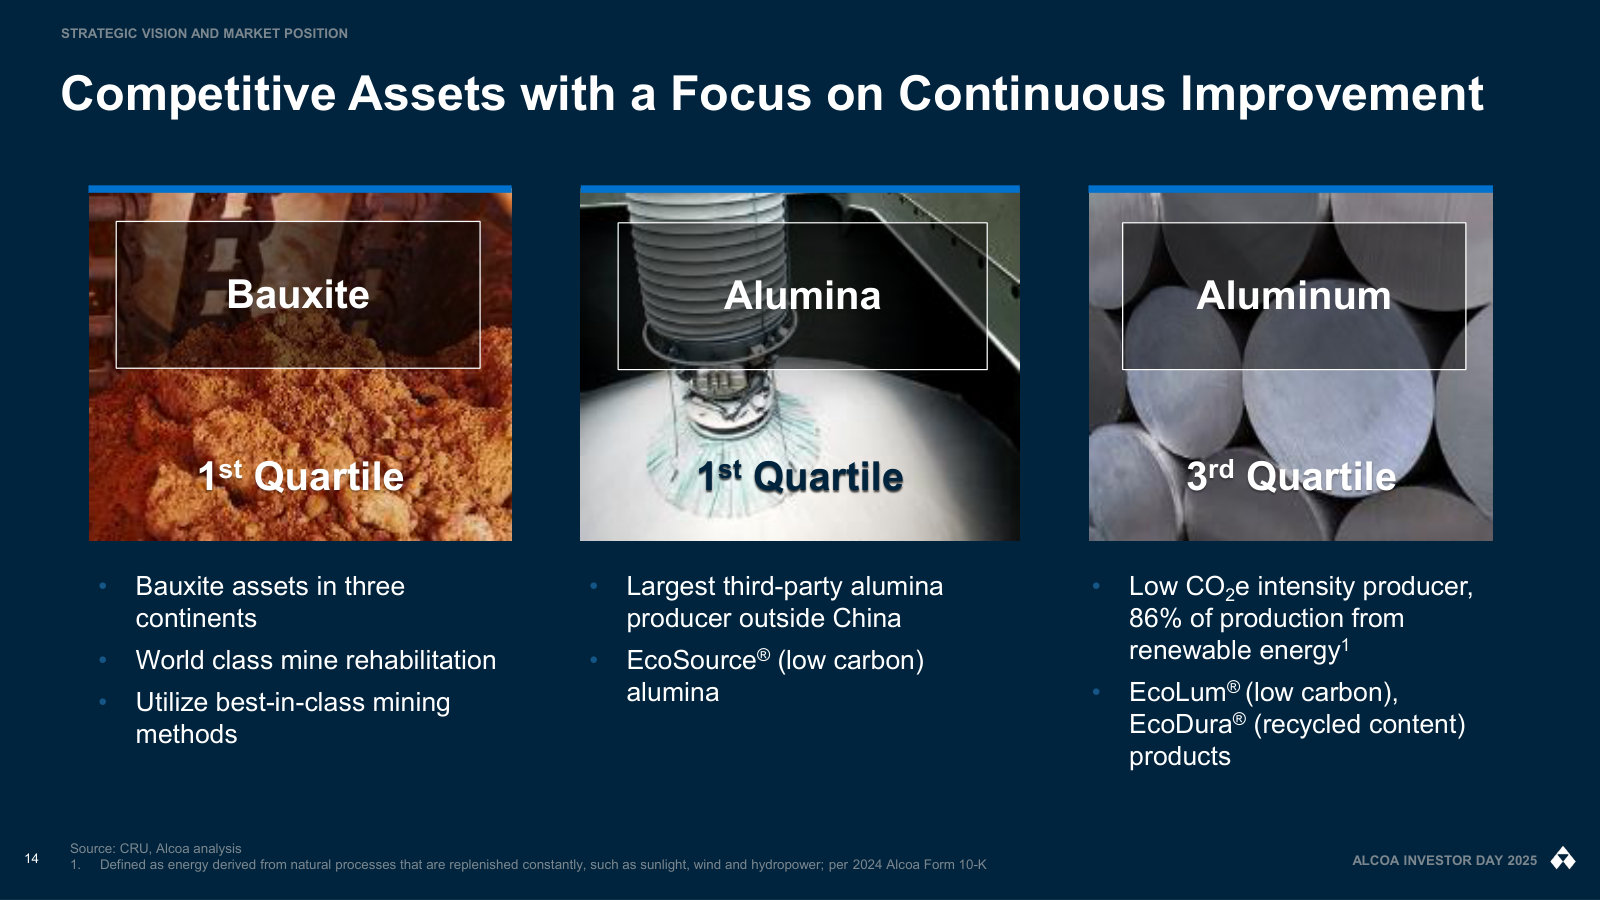
The claim itself is specific and, unusually for a moat, third-party graded. Alcoa is "the largest alumina producer outside of China and the largest supplier of third-party alumina outside of China," and it "had an average cost position in the first quartile of global alumina production in 2025, as determined by CRU," an independent commodity-intelligence firm [2]. It is also "among the world's largest bauxite miners," feeding roughly three-quarters of its own mined ore into its refineries [3]. Scale and a low, independently confirmed cost rank are precisely what a commodity producer needs, because they are the only edge a price war cannot compete away.
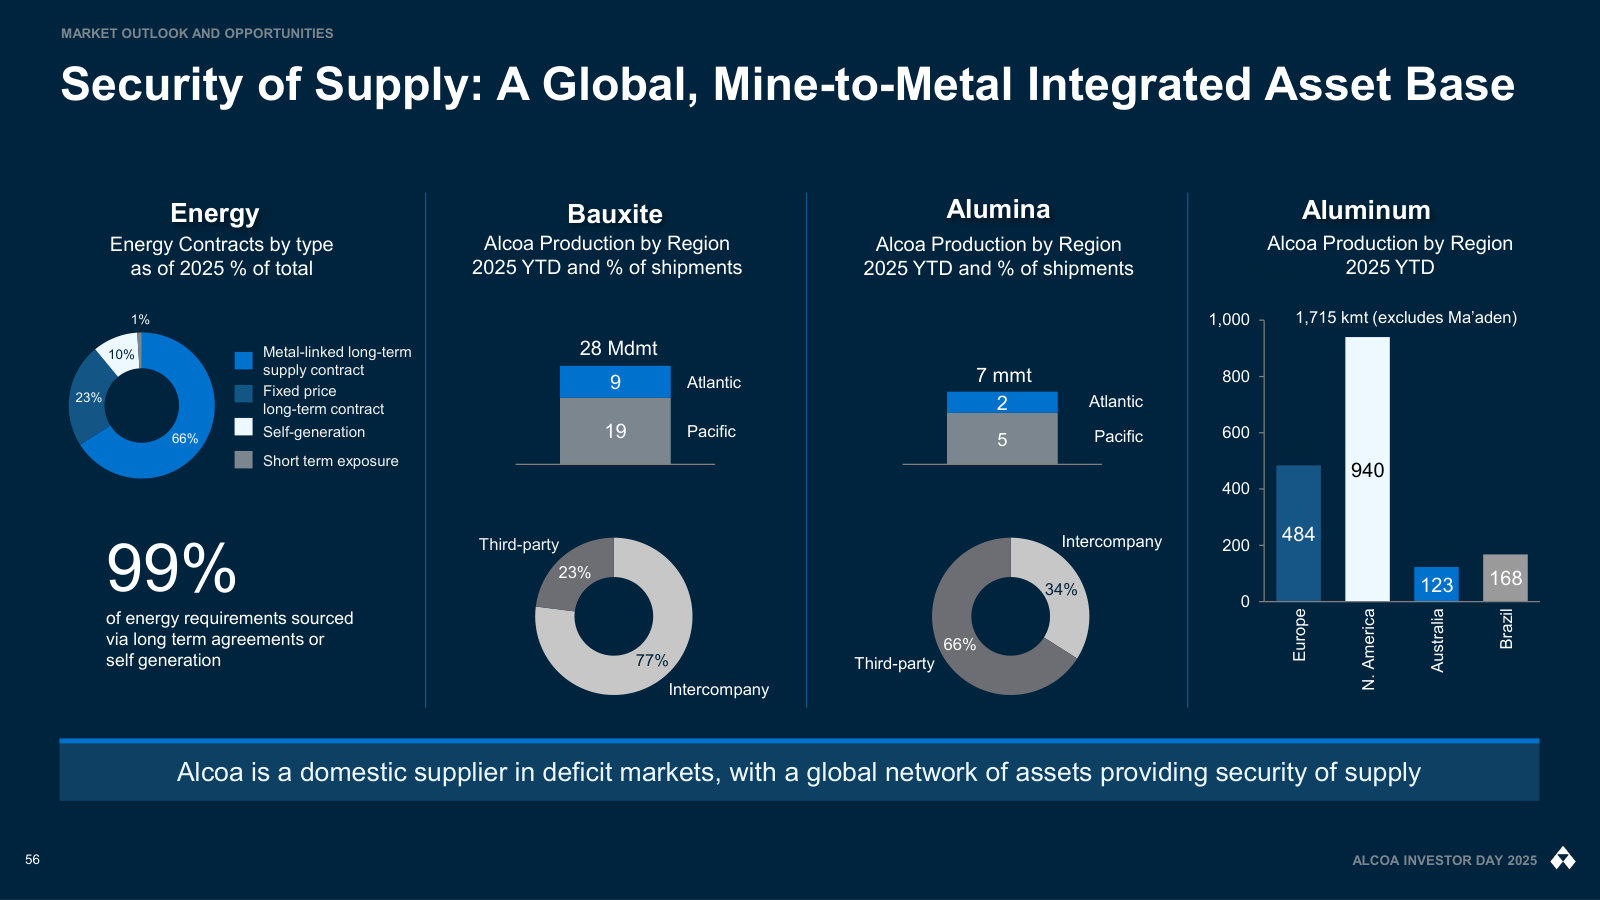
What sets a producer's place on the curve is, above all, energy — and this is where Alcoa's structural asset sits. Energy is roughly a quarter of the cost of refining alumina and electric power is roughly a quarter of the cost of smelting aluminum; Alcoa generates about 11% of its smelter power itself and buys the rest under long-term arrangements, and about 86% of its smelting portfolio runs on renewable, mostly hydroelectric, power [4] [5]. Cheap, firm, long-dated power is a hard thing to copy: electricity markets are regional, and a new entrant cannot conjure a hydro dam or a forty-year contract. The peer paperwork makes the point cleanly. Norsk Hydro describes its own lowest-cost smelter, Qatalum, as "a first quartile smelter on the global cost curve" and "among the world's lowest cost smelters" — and attaches the reason directly to a "40 year gas supply contract expiring in 2049" [6]. Century Aluminum, the US pure-play, lists the identical cost drivers — "alumina, electrical power and carbon products" — and notes that because it sells at LME-linked prices, it cannot pass a cost increase to customers [7]. Three producers, three sets of shareholders, one conclusion: who owns cheap firm power makes money through the cycle, and everyone else is the marginal tonne.
Where the edge is slipping
A cost-curve position is a snapshot of an operating asset, not a permanent grant — and Alcoa says so itself, in the same paragraph that stakes the first-quartile claim. "Increased production costs in recent years caused by lower bauxite grades in Australia could place our Alumina segment in the second quartile until new mine regions are accessed" [8]. The mechanism is concrete. The ore in Alcoa's mature Western Australian mines is getting leaner; leaner ore means more rock moved and more energy burned per tonne of alumina, which pushes the refineries up the curve. The fix is to open richer new mine regions — and that requires ministerial approval from the Western Australian government.
That approval is the single commitment in Alcoa's recent record that keeps moving. Having guided investors to expect ministerial sign-off by the end of 2026, management conceded on its second-quarter 2026 call that "while my confidence in the outcome remains unchanged, the timing could extend beyond our original expectations" [9]. Confidence in the eventual outcome, uncertainty on the date, contingency plans for a six-month delay: it is the language of a timeline that has already slipped and may slip again. This is the load-bearing risk to the cost thesis, because the same lower-grade bauxite that threatens the quartile is the reason the goodwill on the Alumina segment was written to zero in the prior act.
Management's own filing flags that lower Australian bauxite grades could move the Alumina segment from the first to the second cost quartile "until new mine regions are accessed" — and the Western Australian mine approvals that would open those regions have slipped from an end-2026 target to a timing management now says "could extend beyond" it.
Sources: FY2025 Form 10-K, Competition [10]; Q2 FY2026 earnings call [11].
The assumption underneath
The phrase "largest producer outside China" carries a hidden condition, because China is not a small part of this market — it is roughly 60% of it. Chalco, China's largest producer, reports that domestic operating capacity of electrolytic aluminum reached 44.83 million tonnes at the end of 2025, "basically hitting the 'ceiling'" — the self-imposed cap near 45 million tonnes — against global output of 74.52 million tonnes, of which China supplied 59.4% [12]. The ex-China cost thesis — the idea that Western producers face a supply-constrained market where their metal is needed — depends on that ceiling holding. Century, in the US, describes the same load-bearing fact from its own vantage: the global market is short because China is "very near its 45 million tonne production cap" [13].
The uncomfortable part is that the ceiling is a policy choice, not a law of physics. Alcoa's own risk factors are explicit: Chinese production "can fluctuate based on Chinese government policy, such as the level of enforcement of production capacity limits and/or licenses and environmental policies" [14]. A cap that Beijing enforces today it can relax tomorrow, and Chalco already describes output creeping up to the line rather than stopping short of it. So the cost edge that looks like a physical fact — Alcoa's refineries are cheaper than the marginal Chinese refinery — is only as durable as a Chinese enforcement decision Alcoa does not control. That does not make the edge illusory; it makes it contingent, and the contingency belongs on the ledger.
Defending the position by acquisition
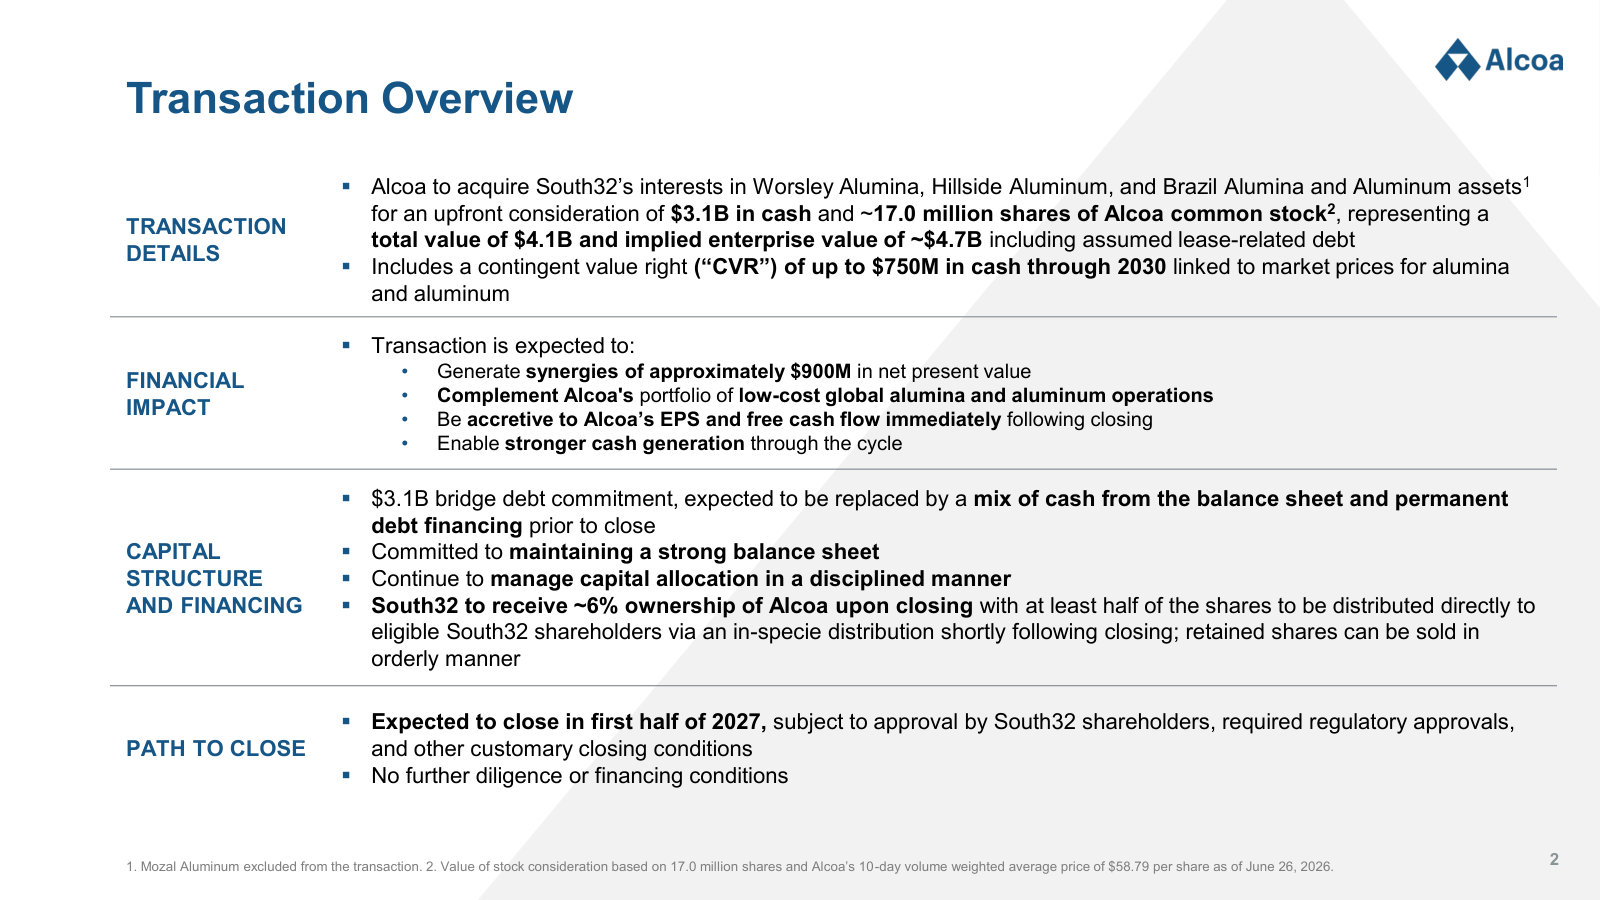
Faced with an eroding grade and a fixed set of low-cost assets, Alcoa has chosen a distinctive way to defend its curve position: it buys existing low-cost tonnes rather than building new ones. In August 2024 it acquired all the shares of Alumina Limited, its long-standing partner in the AWAC bauxite-and-alumina joint venture, taking full ownership of tier-one Australian assets it already operated [15]. In June 2026 it went further, agreeing to buy South32's entire upstream aluminum business — the "AliGroup," including 86% of the Boddington bauxite mine and Worsley refinery — for roughly $3.1 billion in cash plus about 17 million Alcoa shares, with up to $750 million more contingent on future prices [16]. Alcoa's stated rationale is precisely the subject of this chapter: the assets are expected to "sustainably improve Alcoa's position on the global alumina and aluminum cost curves" [17]. Notably, South32 was one of the competitors Alcoa's own 10-K names in the alumina market — so the deal both improves the curve and removes a Western rival from it.
| Consolidation step | What it absorbs | Consideration |
|---|---|---|
| Alumina Limited (closed Aug 2024) | Full ownership of the AWAC bauxite/alumina JV | Equity |
| South32 AliGroup (announced Jun 2026, pending) | A named competitor's upstream — Boddington/Worsley (86%), Hillside, Brazil stakes | ~$3.1B cash + ~17M shares + up to $750M contingent |
Sources: FY2025 Form 10-K, AWAC [18]; Q2 FY2026 Form 10-Q [19].
That buy-not-build stance shows up plainly against peers. Alcoa spent 4.8% of revenue on capital expenditure in 2025, a fraction of the 21.4% and 17.4% that the diversified majors Rio Tinto and South32 reinvested, and it grows its footprint by writing cheques for competitors instead.
Source: derived from FY2025 reported financials — Alcoa and peers Rio Tinto, South32, Century Aluminum, as reported.
The comparison against those same peers on the operating scoreboard is where the low-cost claim gets its honest qualifier: on the numbers that a wider lead would produce, Alcoa is mid-pack, not out front.
Source: FY2025 reported financials — Alcoa, Rio Tinto, South32, Century Aluminum, as reported.
Alcoa's revenue grew 7.9% against a 13.9% peer median, and its free-cash-flow margin of 4.4% trailed the 5.7% median. A first-quartile cost position has not, on this year's evidence, translated into a leading conversion of sales into cash relative to the group. And the last column carries a tell: Alcoa's diluted share count rose 22% in a single year while every peer held roughly flat — the visible footprint of paying for growth with stock. What that dilution cost per share, and how it squares with the buybacks the company promised at the last peak, is the ledger of the next act (The Operator's Word); here it is enough to note that the way Alcoa defends its curve is by issuing equity to absorb competitors, not by out-investing them.
The opposite strategy is visible one filing over. Century, the closest US pure-play, is not buying — it is building, with its joint-venture partner Emirates Global Aluminum, a 750,000-tonne smelter in Oklahoma that "will more than double total U.S. aluminum production" [20]. It would be "the first new smelter in the U.S. in nearly 50 years," backed by a $500 million Department of Energy grant, with EGA owning 60% and Century 40% [21]. New Western smelting capacity is years and tens of billions of dollars away, so it is not an immediate threat to Alcoa's curve. But it sets the strategic contrast sharply: while Alcoa consolidates the existing low-cost base, at least one rival is trying to add to the marginal supply that the ex-China deficit thesis depends on staying scarce.
A carbon edge, not yet priced
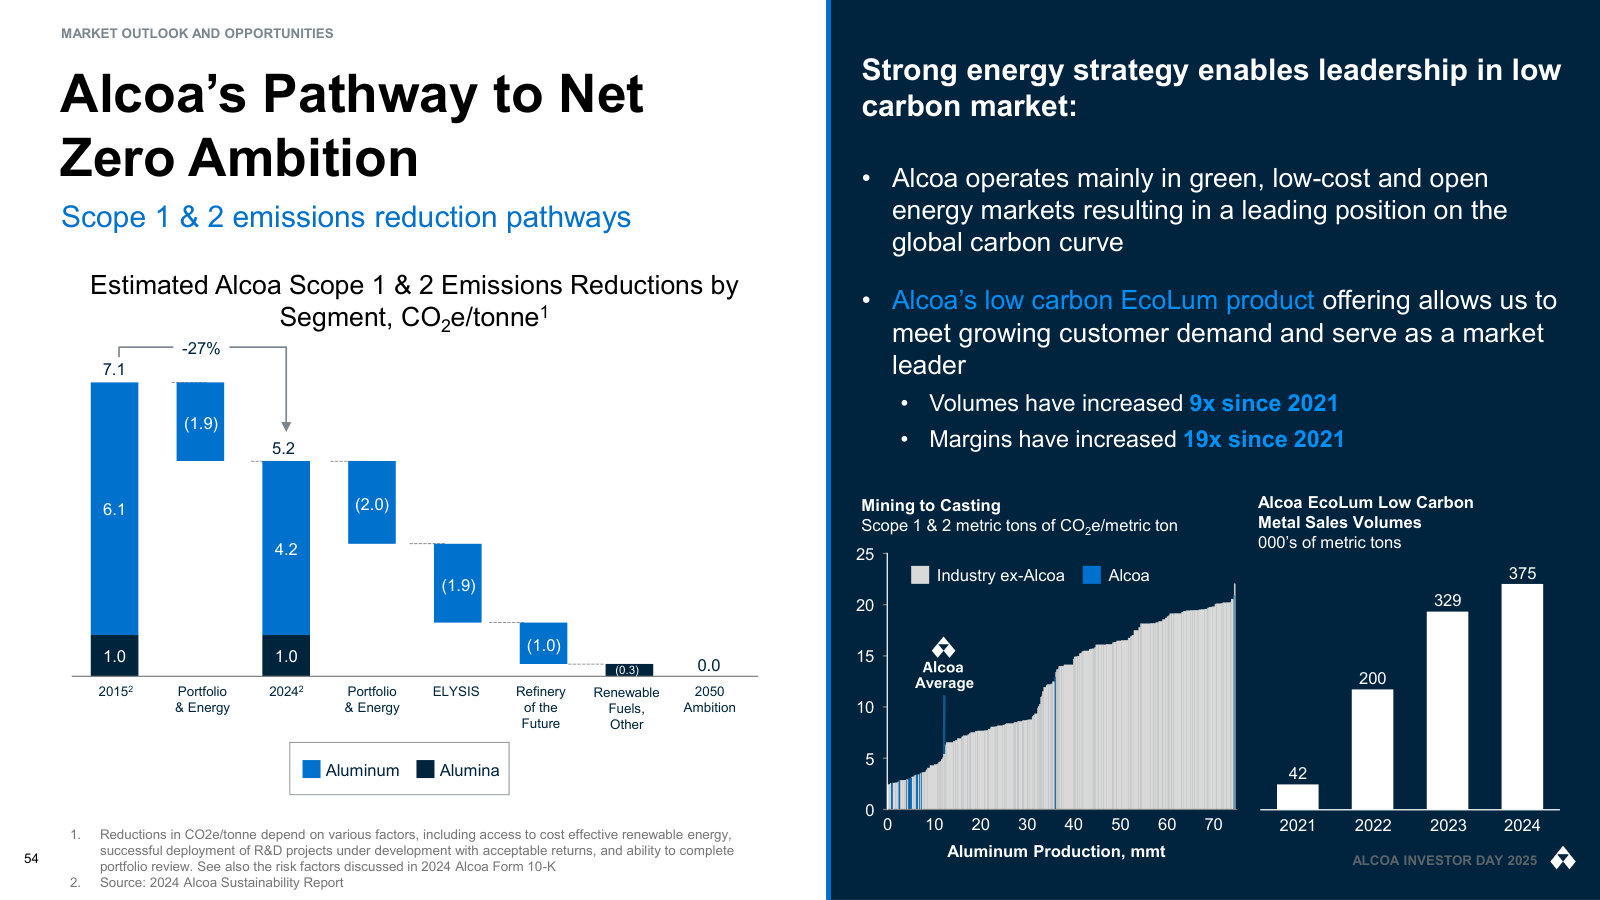
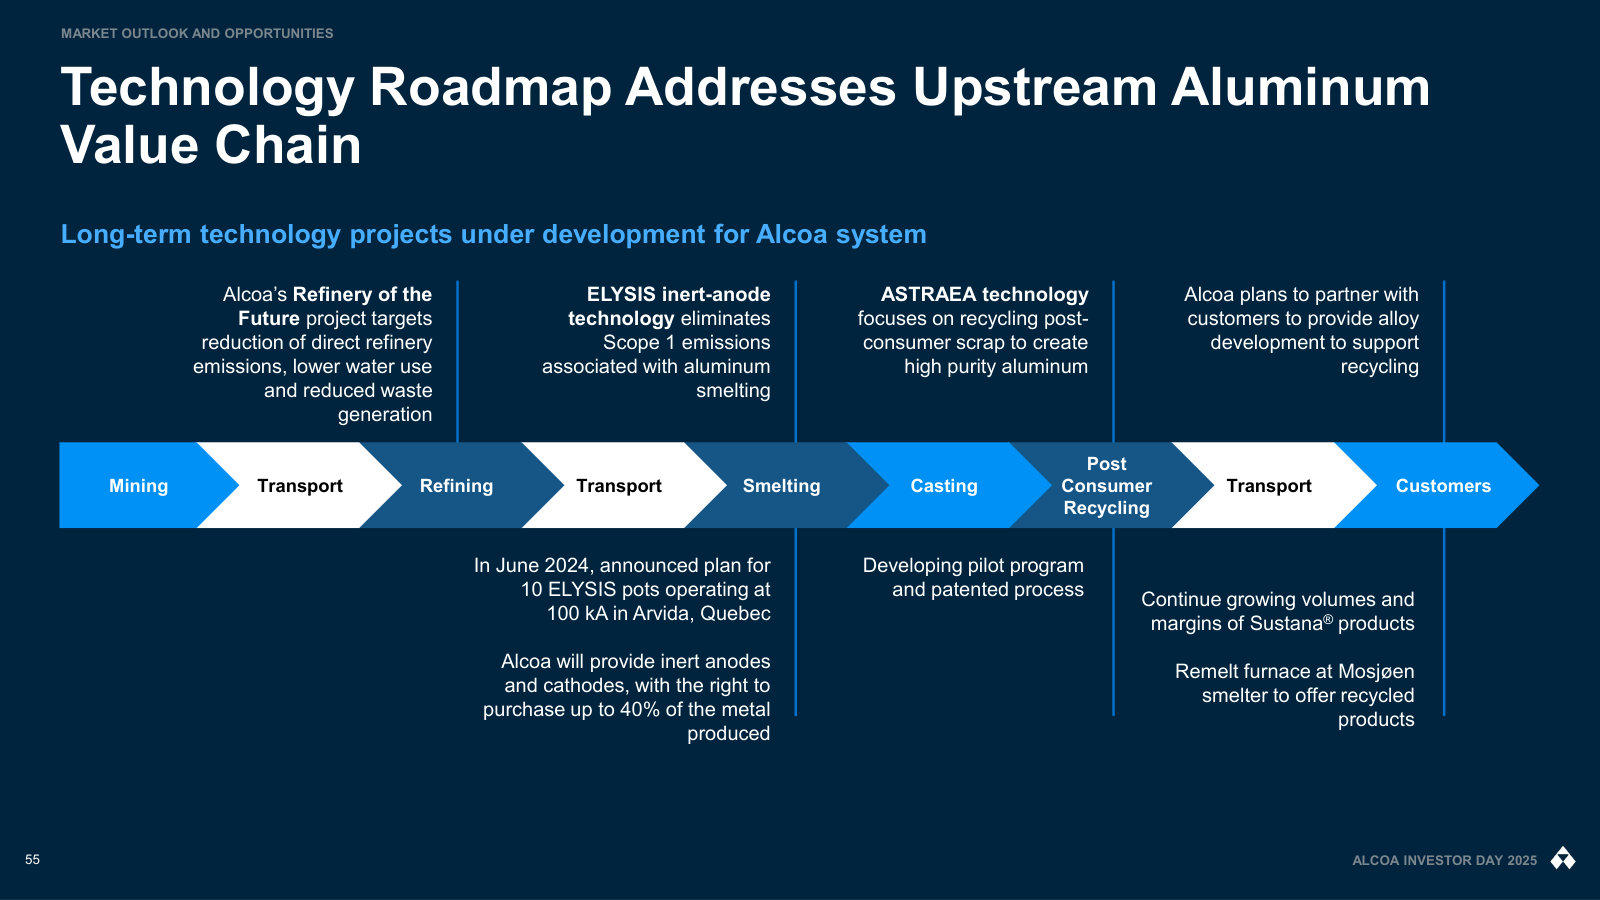
There is one place the cost edge could widen without a new mine or a new smelter: carbon. Alcoa's ~86% renewable-powered portfolio already produces low-carbon metal, and two forces are turning that from a marketing line into a potential cash advantage. The EU's Carbon Border Adjustment Mechanism — a "levy on carbon-intensive imports" — reprices metal by its carbon content in European markets [22], which should advantage a hydro-based incumbent over coal-based new supply. And Alcoa co-owns ELYSIS, an inert-anode smelting technology that "eliminates direct greenhouse gas emissions from the traditional aluminum smelting process and, instead, emits oxygen" [23].
The honest caveat is that none of this is yet a number. No producer in the corpus — not Alcoa, not Norsk Hydro, not Century — quantifies a per-tonne "green premium" in dollars, and ELYSIS is years from commercial scale. So the carbon angle is real optionality on the cost edge, not a proven extension of it; it belongs in the same category as the China cap and the mine approvals — a lever that could matter, priced today at roughly zero.
Where the record stands
Alcoa's moat is cost and scale, and nothing else — a price-taker has no other kind. On the evidence, that moat is genuine: an independently graded first-quartile alumina position, a bauxite base among the world's largest, and a smelting fleet on cheap, long-dated, mostly renewable power that a new entrant cannot readily replicate. But it is a narrower and more contingent edge than "largest outside China" suggests. The same disclosure that stakes the first quartile warns of a slip to the second on falling ore grades; the approval that would arrest that slip has already moved and may move again; the ex-China scarcity the position trades on depends on a Chinese policy ceiling management expects to be tested; and the operating scoreboard shows a mid-pack converter, not a runaway leader, defending its rank by acquiring competitors rather than out-earning them.
What would firm the read is straightforward and checkable: a Western Australian ministerial approval landing on or near schedule, and CRU's next cost-curve grade holding Alcoa's alumina in the first quartile. What would weaken it is the mirror image — a confirmed slip to the second quartile, or a Chinese relaxation of the 45-million-tonne cap. How the acquisitions that widened this base were financed, and what they did to the per-share story, is the ledger the next chapter opens.
The Operator's Word
The buy-not-build strategy left a visible footprint: Alcoa's diluted share count rose roughly 46% in two years, from 178 million at the end of 2023 to 261 million at the end of 2025. That is the largest single fact in the company's recent capital story, and it does not appear on the line most investors check first — the cash-flow statement reports zero cash spent on acquisitions in every year of the period. To understand how Alcoa got here, and whether management's word has held, the deployment has to be read as one ledger rather than as separate line items. Read that way, it tells two consistent stories at once: a team that reliably delivers what it promises operationally, and a team that has quietly deferred the shareholder returns it announced at the last cycle peak.
The Promises the Team Kept
The record being judged is mostly this management's own. Molly Beerman became chief financial officer in February 2023 and William Oplinger — a two-decade Alcoa insider, previously chief financial and then chief operating officer — became chief executive in September 2023, succeeding Roy Harvey. Almost every commitment that has since come due was made and settled by that pair, which makes the said-versus-did test a clean one.
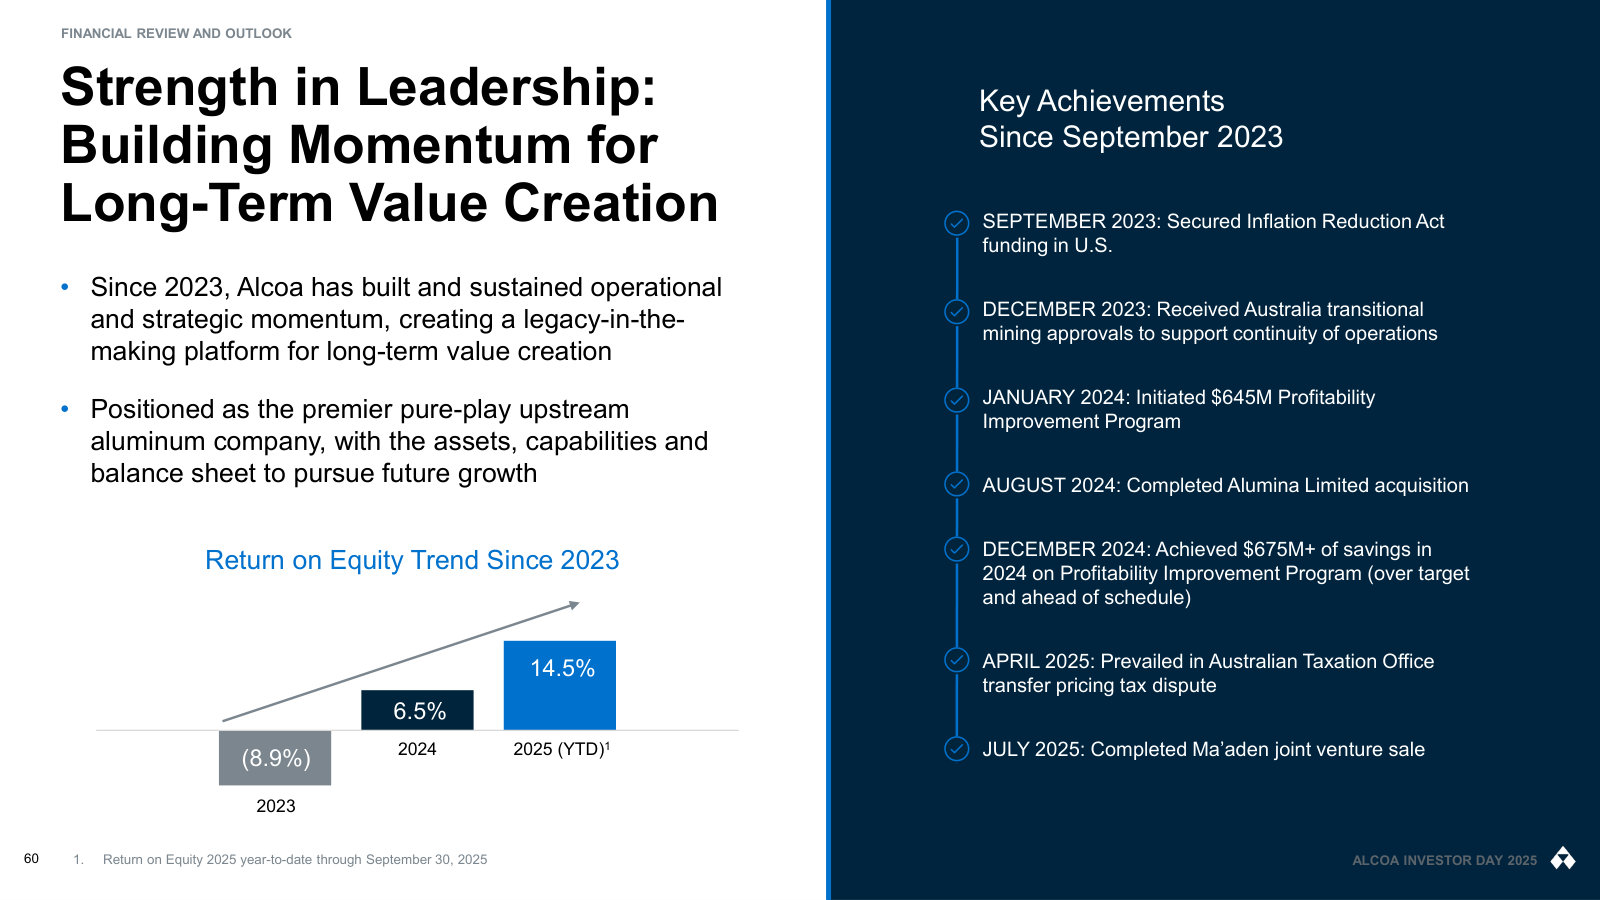
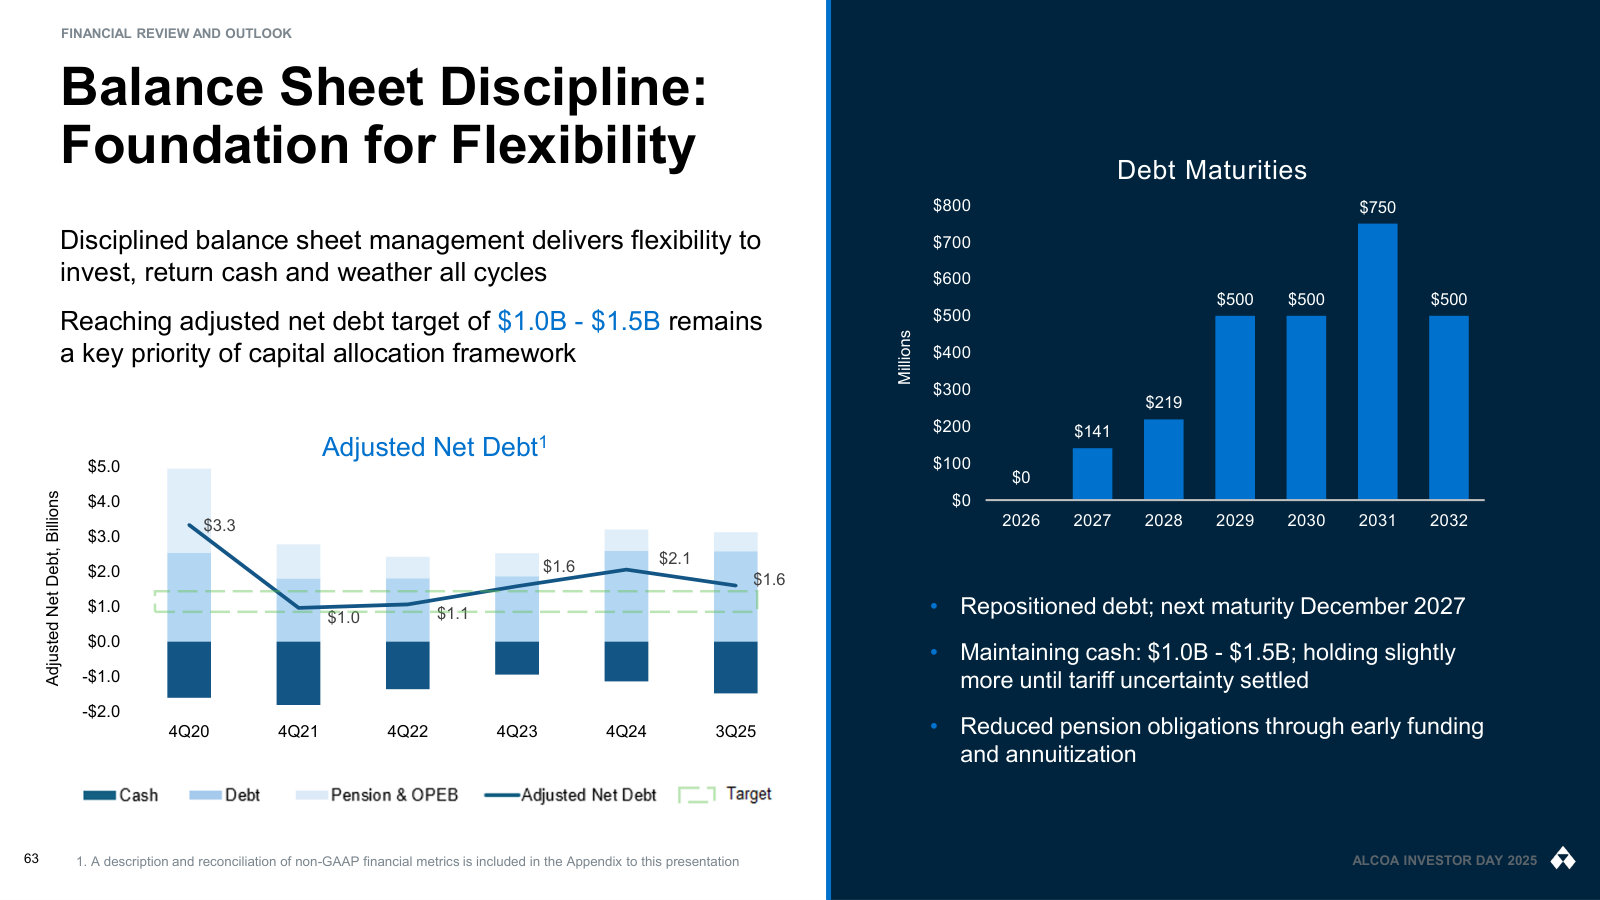
On the operational side, the team has delivered. Into the 2023 trough — a net loss, free cash flow of -$440 million, the Kwinana refinery curtailment — management set a roughly $645 million profitability-improvement program. A year later it reported it had "delivered and exceeded" the target "ahead of schedule," reaching $675 million [1]. The balance-sheet promise was kept too: management defined an adjusted net-debt target of $1.0 to $1.5 billion — a measure that layers pension and other retirement liabilities on top of reported borrowings — and reached that range by the end of 2025, having stood at $2.1 billion as recently as the first quarter [2]. On the simpler reported basis, net debt fell from $1.41 billion in FY2024 to $842 million in FY2025.
Source: net debt derived from reported financials (FY2021–FY2025 Forms 10-K); the $1.0–1.5B adjusted net-debt target (which adds pension and retirement liabilities) is management's own, stated on the Q1 FY2025 earnings call [3].
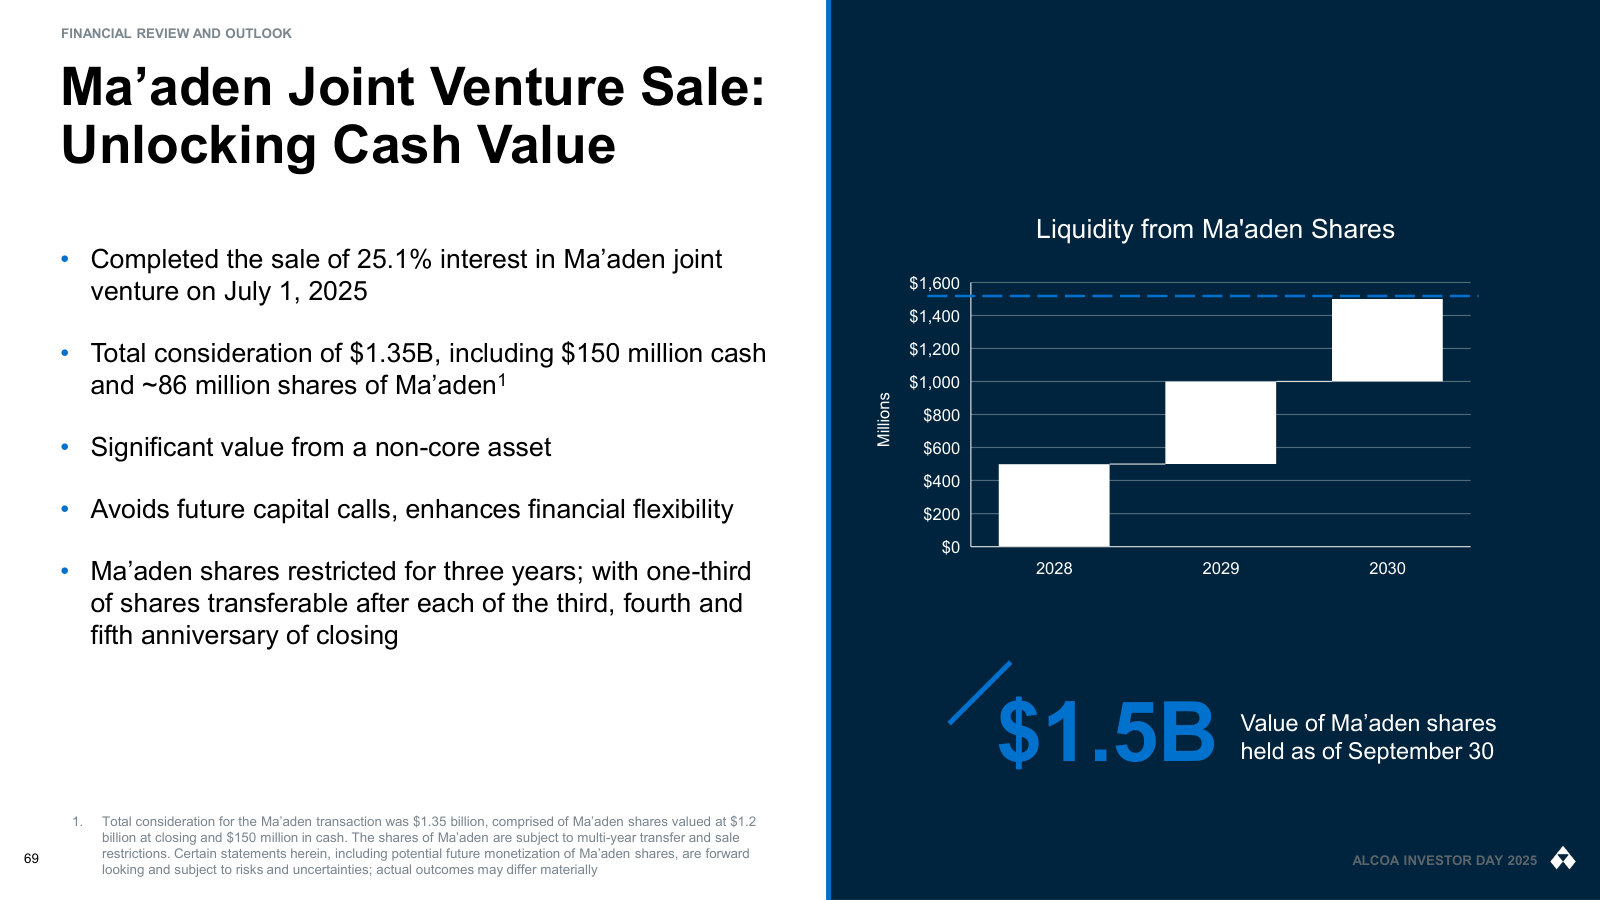
The portfolio commitments held on the same schedule. Management restarted the San Ciprián smelter in Spain and, in July 2025, monetized the non-core 25.1% stake in its Saudi Arabian joint venture, exchanging it with Ma'aden for consideration of roughly $1,350 million — cash plus marketable shares — which fed the deleveraging above [4]. Credibility runs both ways, and on operations and the balance sheet the arrow points up.
Sources: Q4 FY2024 [5] and Q1 FY2025 [6] earnings calls; FY2025 10-K Note C [7].
The Return That Stopped
The commitment that has not held is the one made to shareholders directly. At the 2022 cycle peak, then-CEO Roy Harvey returned $387 million year-to-date — $275 million of buybacks plus dividends — and announced a fresh $500 million repurchase authorization on top of $150 million still open [8]. Returning cash to shareholders was named, explicitly, as one of three priorities ranked after protecting the balance sheet [9].
What followed was silence on that channel. Buybacks went to zero in 2023, 2024 and 2025, and the July 2022 authorization sat entirely intact: as of December 31, 2025 the full $500 million remained available, unused for roughly three and a half years [10]. The only return that continued was the quarterly dividend, held flat at $0.10 per share every quarter since the program began in late 2021 [11].
Source: dividends paid per FY2025 10-K Statement of Consolidated Cash Flows [12]; repurchases per the FY2022 buyback disclosure [13] and company cash-flow data.
The growing dividend line is largely optical. Total dividend cash rose from $72 million in 2023 to $104 million in 2025, but the per-share rate never moved; the outlay grew only because there were more shares to pay [14]. On a per-share basis, the shareholder return has been flat for four years while analysts pressed repeatedly, across at least six recent calls, on when buybacks would resume — and were deferred each time.
One number captures how that period can be misread. Buybacks plus dividends as a share of free cash flow swung from -16.4% in FY2023 to 211.9% in FY2024, a move that looks like a policy reversal toward aggressive payout. It is almost entirely a denominator effect. The dividend numerator barely moved, from $72 million to $89 million; what changed was free cash flow, which climbed off a -$440 million trough to a razor-thin +$42 million, so the ratio against it careened. The swing measures the depth of the 2023 cash trough, not any decision to return more.
Source: free cash flow and shareholder-return figures derived from reported financials (FY2023–FY2024 Forms 10-K); dividends paid per FY2025 10-K Statement of Consolidated Cash Flows [15].
The Ledger the Cash Flow Hides
If the returns channel went quiet, the deployment channel did not — it simply ran through a line the cash-flow statement does not show. The single largest capital move of the period was the August 1, 2024 acquisition of Alumina Limited, which took Alcoa's stake in the AWAC bauxite-and-alumina joint venture from 60% to 100%. It was paid for entirely in stock: 78,772,422 common and 4,041,989 preferred shares, for aggregate consideration of approximately $2,700 million [16].
Because Alcoa was buying out a 40% noncontrolling interest ($1,472 million) rather than acquiring a new business, the deal was booked as an equity transaction — net assets and costs added to additional capital, with no goodwill recognized. The mechanical result is that the cash-acquisitions line reads $0, technically correct and quietly misleading: the biggest deal in the period is invisible where a reader would look for it [17].
The true cost shows up in the share count. Diluted shares went from 178 million (FY2023) to 214 million (FY2024) to 261 million (FY2025). Employee stock compensation cannot explain it — that expense ran just $41 million, $36 million and $35 million across 2025, 2024 and 2023, or roughly one to one-and-a-half million shares a year [18]. The dilution is acquisition currency, not pay. For an investor, the ledger of how growth was financed is the share count, not the cash-flow acquisitions line — and on that ledger holders own about 46% less of the company per share than they did two years earlier.
Source: diluted share counts per Forms 10-K (FY2021–FY2025); the FY2024–FY2025 step reflects the all-stock Alumina Limited issuance per FY2024 10-K Note C [19].
From Net-Debt Target to Mega-Deal
The sequence is what makes the capital story cohere. Management deferred buybacks to reach a net-debt target, reached it — and then, rather than turning the returns channel back on, committed the restored balance sheet to the largest acquisition in Alcoa's history.
The pivot was fast. On the Q4 2025 call, in January 2026, management said plainly it had "no greenfield expansion plans for aluminum" and none for refining or bauxite, because energy prices do not support the returns; growth would be limited to low-capital brownfield work [20]. Five months later, on June 30, 2026, it agreed to buy South32's bauxite, alumina and aluminum assets — the "AliGroup" package — for $3,100 million of cash plus roughly 17 million Alcoa shares valued at about $1,000 million, a 5% annual ticking fee on the cash portion until closing, and up to $750 million of contingent payments tied to future alumina and aluminum prices [21]. The $3.1 billion cash leg is backed by a committed 364-day bridge loan of the same size — the re-leveraging, in one line [22].
Management framed it as the largest transaction in company history, carrying roughly $900 million of net-present-value synergies and lifting capacity by about 53% in alumina and 37% in aluminum, with cash consideration sized to keep pro forma leverage within 2.0x [23]. Whatever its strategic merits, its effect on the capital ledger is unambiguous: the deleveraging that shareholder returns were postponed to achieve has become the funding capacity for a deal, again paid partly in stock, rather than for the buybacks the 2022 framework promised.
Sources: FY2022 buyback authorization [24]; Alumina Limited terms, FY2024 10-K Note C [25]; dividend, FY2025 10-K Note N [26]; AliGroup terms, Q2 FY2026 10-Q Note C [27].
Governance
The setting around these decisions is a conventional US large-cap. Ten of eleven directors are independent, with a separate independent chairman distinct from the chief executive; only Oplinger sits on the board as a non-independent member [28]. Pay is heavily equity-weighted and largely at risk: FY2024 chief-executive compensation was $13.5 million with no cash bonus and roughly two-thirds in stock, a 129-to-1 pay ratio [29]. There is no control block and no dual-class structure. The one feature worth carrying forward is that the annual incentive keys off adjusted-EBITDA and free-cash-flow measures whose adjustments management itself sets — an alignment question the record above should be read against, not a governance defect on its face.
Where the Record Stands
The honest state of the ledger is two-sided and specific. This management does what it says operationally: the profitability program was beaten early, the net-debt target was reached, San Ciprián restarted, the Saudi stake sold. It has not done what it said on returns: the 2022 buyback authorization has sat unused for three and a half years, the per-share dividend has not risen since 2021, and growth was financed by issuing shares — about 46% more of them in two years — with the restored balance sheet now committed to the largest deal in the company's history rather than to the returns that were deferred to build it.
That leaves an open commitment a reader can hold management to on dated, checkable terms: the AliGroup acquisition, expected to close in the first half of 2027, and the synergy and accretion claims attached to it, are the next entry the said-versus-did ledger will settle. What the market now pays for a company whose recent record profit came largely from one-time gains — and what its forward multiple quietly assumes — is the subject of What the Price Assumes.
What the Price Assumes
Alcoa closed 2025 with the largest statutory profit in its history as a standalone company: net income attributable to Alcoa of $1,157 million, against $60 million the year before [1]. In the same year, the metric management actually runs the business on — Total Segment Adjusted EBITDA — fell, to $1,940 million from $2,065 million [1]. A record profit and a lower operating result in the same twelve months is the reconciliation this chapter has to settle, because the multiple the market puts on Alcoa depends entirely on which of those two numbers is treated as the base.
The capital ledger (The Operator's Word) treated FY2025's headline earnings only as the thing that let management reach its net-debt target. Here they are the problem to solve: what part of that profit is repeatable, what the low forward multiple is quietly built on, and why a stock that screens cheap on cash flow has also fallen further than the one priced peer in its set.
The record profit is mostly a one-time gain
The gap between the two numbers is one line. Consolidated pretax income of $1,064 million in FY2025 came almost entirely from "Other (income) expenses, net" of $1,057 million — a line that was a $91 million expense the year before [1]. Two events fill it. On July 1, 2025, Alcoa sold its 25.1% interest in its Saudi Arabia joint venture to Ma'aden for total consideration of $1,350 million — of which only $150 million was cash — and booked a gain of $786 million, net of costs [2]. The Ma'aden shares it received were then marked to market for a further $197 million gain [2]. Together, roughly $983 million — about 92% of pretax income — is a non-recurring gain that was overwhelmingly non-cash.
Source: FY2025 Annual Report (Form 10-K), reconciliation of Total Segment Adjusted EBITDA to consolidated net income [1].
The two bars move in opposite directions because they measure different things. Statutory net income rose nineteen-fold on the asset sale; the operating result fell on weaker segment economics — the same two-speed cycle established in The Price-Taker, with the Alumina segment sliding as the Aluminum segment held. Reported diluted earnings of $4.37 per share [3] carry that one-time gain inside them; a trailing multiple built on that figure is measuring the price against a base the company is unlikely to repeat.
One qualifier keeps this from being a quality flag. The gains never touched operating cash. Both are stripped out in the cash-flow reconciliation — a $784 million removal for asset sales and the $197 million mark-to-market — yet cash from operations of $1,185 million still exceeded net income, supported by $623 million of depreciation and a largely non-cash $918 million restructuring add-back [4]. Over FY2021–FY2025, cumulative operating cash flow of roughly $3.6 billion and free cash flow near $1.0 billion both exceeded cumulative net income of about $0.9 billion, because depreciation runs above capital spending and the loss years were driven by non-cash charges. The cash conversion is genuine over the cycle; it is the headline earnings number, not the cash, that flatters the trailing view.
A footnote to the earnings-quality read, because it recurs. The items Alcoa labels restructuring are not occasional: $918 million in FY2025, $341 million in FY2024, $184 million in FY2023, plus a $144 million goodwill write-off that took goodwill to zero [1]. The audit is otherwise clean — an unqualified opinion, no auditor change, no working-capital build — with a single Critical Audit Matter: the $1,405 million estimate for mine reclamation and bauxite-residue closure that generates those recurring charges as smelters and refineries close [5]. The reporting is trustworthy; the "adjusted" figures simply exclude a real, repeating cost.
What the forward multiple is built on
Measured against next year's earnings rather than last year's, the stock is not expensive. At the July 31, 2026 close of $45.26 and a market value of $11.8 billion, Alcoa trades at roughly 6.8x consensus FY2026 EPS of $6.65 and about 4.2x forward EV/EBITDA, for a forward free-cash-flow yield near 7.4% — versus a trailing multiple close to 12x on normalized earnings.
Forward P/E (FY2026E, x)
EV / FY2026E EBITDA (x)
Forward FCF Yield
Trailing P/E, normalized (x)
Source: derived from the 2026-07-31 close and consensus estimates (S&P Capital IQ); market value and net debt per FY2025 reported financials.
The forward multiple sits below the trailing one for a single reason: consensus embeds a step-change in earnings that has not happened yet. Analysts model FY2026 revenue up 15.7% and EBITDA up roughly 52%, with normalized EPS rising 76% year over year. The question is where that jump is supposed to come from, and the broker models are unusually specific about the answer.
Source: Visible Alpha broker models (10 brokers), consensus segment EBITDA; FY2025 actuals per company filings.
Nearly all of the modeled earnings step-up comes from one segment. Aluminum EBITDA is modeled up 245% to about $3.6 billion, while the Alumina segment swings to a modeled loss of roughly $0.3 billion as realized alumina prices near $338 per tonne fall below cash cost near $405 per tonne. And the Aluminum number rests on one price. Broker models put the Section 232-inflated Mid-West premium near $2,342 per tonne in FY2026, close to double its FY2025 level, and that premium alone accounts for the bulk of the segment's per-tonne EBITDA jump.
Source: Visible Alpha broker models (7 brokers), Mid-West premium per tonne; FY2025 actual per company filings.
That is the substance of what the price underwrites. A buyer at $45.26 is not paying for a broad commodity recovery; the aluminum market is already described by management as tight, low on inventory, and in deficit for the year [6]. The buyer is paying for the durability of a tariff-set premium that brokers themselves cannot agree on beyond next year: their FY2028 estimates for that same premium span $838 to $2,340 per tonne. The embedded growth is concentrated in one policy-dependent price, which is why the multiple compresses so quickly the moment the forward year comes into view.
Cheap on cash flow, and de-rated harder than the peer
Two of the sharpest signals in the numbers point in opposite directions at once, and both belong here.
The first is cheapness. Alcoa's trailing free-cash-flow yield of 4.8% is 2.41 times Century Aluminum's 2.0% — the market pays a lower price for each dollar of Alcoa's trailing cash flow than for its one priced peer's (anomaly A2). The second is stress. Over the same window, Alcoa's shares sat 46.0% below their three-year high, against 34.9% for Century — an 1,109-basis-point deeper drawdown (anomaly A3).
Source: reported financials and daily price history to 2026-07-31, as reported; peer set is a single priced comparator (see below).
The two coexist because the cash-flow yield is measured on a trailing year that included a cyclically strong Aluminum result, while the drawdown is measured against a forward tape that has already begun to roll over. The de-rating is not a company-specific stumble. From a three-year low of $22.57 in April 2025 the stock ran 271% to a peak of $83.79 on June 2, 2026, then gave back 46% over roughly six weeks — a near-continuous slide rather than a single earnings gap.
3Y Low (2025-04-08)
3Y High (2026-06-02)
Close (2026-07-31)
Drawdown from High
Source: daily price history to 2026-07-31, as reported.
Management dates the reversal to the metal, not the franchise: on the Q2 2026 call it attributed the quarter's soft price realization to LME prices that "declined sharply in the final two weeks of June" [7], and described the LME as having "returned to pre-Middle East conflict levels following a macro-driven correction" while regional premiums held [6]. The expectation reset tracks the aluminum tape rolling over, which is why the cheapness and the stress can both be true.
The peer comparison carries a real limit worth stating plainly: of the six intended comparators, only Century has usable price history loaded. Rio Tinto and South32 have none, and the others lack income statements, so both the "cheaper multiple" and the "deeper drawdown" reads rest on a single name rather than a peer median in any meaningful sense.
The base the multiple is measured against is unstable
A low multiple is only as reliable as the earnings underneath it, and the consensus anchoring Alcoa's is unusually loose. The company has missed both revenue and normalized EPS for two straight quarters. FY2027 normalized-EPS consensus was cut about 18% in the prior 30 days. And the forward numbers carry extreme dispersion: FY2027 EPS estimates span $2.74 to $9.17 across eleven analysts, or 108% of the mean, with FY2028 resting on just five.
Source: consensus estimates (S&P Capital IQ), FY2027 estimate dispersion.
That dispersion is the operating leverage of The Price-Taker showing up in the estimate sheet: because a few-percent move in the aluminum price swings hundreds of millions of dollars of EBITDA, small differences in analysts' price decks produce enormous differences in modeled earnings. The forward multiple is precise; the earnings it divides into are not.
A second instability sits in the cash-flow forecast. Broker models show free cash flow building toward roughly $1.5 billion in FY2027 and net debt swinging to a net-cash position, with that capacity "largely unallocated" and per-share dividends still near zero. Yet the company is simultaneously committing $3.1 billion of cash and about $1 billion of equity to the South32 acquisition [8]. The modeled net-cash build and the deal's outflow point in opposite directions — the consensus cash-flow scalar almost certainly excludes the acquisition — so the "swing to net cash" and the "$4 billion deal" cannot both be read at face value.
The equity leg of that deal compounds a dilution problem the capital ledger already established. Diluted shares rose 22% in FY2025 alone, against a peer group essentially flat, and the pending transaction adds roughly $1 billion more Alcoa stock on top [8]. Absolute free cash flow and per-share free cash flow diverge sharply here; the modeled cash build accrues to a share count that keeps rising. On the balance-sheet side, the two figures a reader has to hold are the FY2025 reported net debt of $842 million and the adjusted net debt of $1.4 billion management cited at the end of June 2026 — the top of its own target range [9], and before any of the South32 cash goes out the door.
What would resolve the price
The market's own read is more constructive than the tape: brokers stand at seven buy, five hold, one underperform, with twelve price targets averaging about $63 and a median of $59.50 — every target above the $45.26 close. The estimate feed carries no live share price, so that gap is best read as sentiment and implied upside rather than a verified quote. It frames the price as discounting the premium's durability more than the analysts' central case does.
What the price is measured on comes down to a short list of checkable items, each falsifiable against a named line in a future filing.
Sources: Q2 FY2026 earnings call, acquisition terms [8]; consensus estimates (S&P Capital IQ) and Visible Alpha broker models.
Reconciled, the picture is coherent rather than contradictory. FY2025's record earnings overstate the base, but the cash conversion under them is real. The forward multiple is genuinely low, but it is low because it is built on a 76% earnings jump concentrated in a single tariff-set premium that even its own modelers cannot agree on past next year. The stock is cheaper on trailing cash flow than its one priced peer, and it has fallen harder — because the cheapness looks backward at a strong year and the drawdown looks forward at a rolling-over price. The two anomalies that opened this report's arithmetic are not a puzzle once the base is sorted; they are the same commodity leverage, read once through last year's cash and once through next year's price. What is left genuinely unresolved is narrow and nameable: whether the Mid-West premium holds near double its historical level, whether alumina climbs back above its own cash cost, and how much of the per-share story the South32 stock consideration resets when the deal closes.
The numbers behind Alcoa Corporation: as-reported financial statements and company metrics for FY2021–FY2025, traced to the source filings, opened with the share-price history those statements have to justify. Every linked figure opens the exact page of the filing it was printed on, with the statement row highlighted. Amounts in US$ millions unless noted.
Reading notes: All four core statements and the segment tables for FY2021–FY2025 are taken from Alcoa's own Form 10-K for each fiscal year (FY2025 10-K also supplies the FY2024/FY2023 comparative segment columns). Display unit is US$ millions, as printed on every statement ('in millions, except per-share amounts'). Revenue by Segment uses Alcoa's reported third-party (external) sales by segment, which reconcile to consolidated Sales via a small 'Other' line (energy/other). FY2021–FY2022 use the recast two-segment presentation (see discrepancies). Segment Adjusted EBITDA is Alcoa's reported segment profit measure (ASC 280); it is a non-GAAP total that reconciles to consolidated income before income taxes in each 10-K's segment note.
Share Price — Full Available History — 37 Years
The stock closed at $45.26 on Jul 31, 2026 — up 609% over the window shown (+5.5% a year), trading between $4.27 and $255.92. At that close the stock trades at 10× FY2025 diluted EPS as reported below.
Source: market price feed, monthly closes, sampled from 9,213 source observations, Jan 1990–Jul 2026. Price return only, excludes dividends. Prices are split-adjusted (1:2 on Feb 27, 1995; 1:2 on Feb 26, 1999; 1:2 on Jun 12, 2000; ×0.333333 on Oct 06, 2016; ×1.24844 on Nov 01, 2016).
Market capitalization $11.8bn and enterprise value $12.7bn.
Market cap = 261.0M shares outstanding × the Jul 31, 2026 close of $45.26. Enterprise value adds total debt of $2.4bn and subtracts cash and equivalents of $1.6bn (net debt of $842mn), from the FY2025 balance sheet. Market-derived figures, shown without filing links.
FY2025 at a Glance
Net income (US$ millions)
Diluted EPS
Source: FY2025 consolidated statements [1] [2] [3] [4]. Click any linked figure to open the filing page with the row highlighted.
Revenue by Segment (Third-Party Sales)
| Revenue by Segment (Third-Party Sales) | FY2021 | FY2022 | FY2023 | FY2024 | FY2025 |
|---|---|---|---|---|---|
| Alumina | 3,375 | 3,724 | 3,613 | 4,662 | 4,447 |
| Aluminum | 8,766 | 8,735 | 6,925 | 7,230 | 8,359 |
| Total segment third-party sales | 12,141 | 12,459 | 10,538 | 11,892 | 12,806 |
| Other | 11 | (8) | 13 | 3 | 25 |
| Consolidated sales | 12,152 | 12,451 | 10,551 | 11,895 | 12,831 |
Source: Note V Segment and Geographic Area Information; segment third-party sales reconciled to consolidated sales [5] [6] [7]. Click any linked figure to open the filing page with the row highlighted.
Segment Adjusted EBITDA
| Segment Adjusted EBITDA | FY2021 | FY2022 | FY2023 | FY2024 | FY2025 |
|---|---|---|---|---|---|
| Alumina | 1,192 | 788 | 273 | 1,408 | 882 |
| Aluminum | 1,879 | 1,492 | 461 | 657 | 1,058 |
| Total Segment Adjusted EBITDA | 3,071 | 2,280 | 734 | 2,065 | 1,940 |
Source: Note V Segment and Geographic Area Information; Segment Adjusted EBITDA is Alcoa's reported measure of segment profit [6] [7]. Click any linked figure to open the filing page with the row highlighted.
Income Statement
Source: Statement of Consolidated Operations [1] [2] [3] [4]. Click any linked figure to open the filing page with the row highlighted.
Columns marked E are consensus analyst estimates from S&P Capital IQ (CapIQ), shown alongside reported results for direct comparison; they are not company guidance.
Estimate source: S&P Capital IQ (CapIQ) consensus, as of 2026-08-01. Estimate figures are S&P Capital IQ consensus (vendor data — no filing page links). EPS and net income use the normalized (adjusted) consensus where the street reports it. Line-item analyst models (segments, drivers, KPIs) are in the Visible Alpha tab.
Balance Sheet
Source: Consolidated Balance Sheet [8] [9] [10] [11]. Click any linked figure to open the filing page with the row highlighted.
Cash Flow
Source: Statement of Consolidated Cash Flows [12] [13] [14] [15]. Click any linked figure to open the filing page with the row highlighted.
Long-Term Record (FY2016–FY2025)
| Fiscal year | Total revenue | Net income attributable to Alcoa | Diluted earnings per share | Operating cash flow | Capital expenditures |
|---|---|---|---|---|---|
| FY2016 | 9,318 | (400) | (2.19) | (311) | (404) |
| FY2017 | 11,652 | 279 | 1.49 | 1,224 | (405) |
| FY2018 | 13,403 | 250 | 1.33 | 448 | (399) |
| FY2019 | 10,433 | (1,125) | (6.07) | 686 | (379) |
| FY2020 | 9,286 | (170) | (0.91) | 394 | (353) |
| FY2021 | 12,152 | 429 | 2.26 | 920 | (390) |
| FY2022 | 12,451 | (123) | (0.68) | 822 | (480) |
| FY2023 | 10,551 | (651) | (3.65) | 91 | (531) |
| FY2024 | 11,895 | 60 | 0.26 | 622 | (580) |
| FY2025 | 12,831 | 1,157 | 4.37 | 1,185 | (618) |
Source: consolidated statements across filings; older years from the standardized feed [12] [1] [13] [2]. Click any linked figure to open the filing page with the row highlighted.
Operating KPIs
| KPI | FY2021 | FY2022 | FY2023 | FY2024 | FY2025 |
|---|---|---|---|---|---|
| Alumina production (kmt) | — | — | 10,908 | 10,034 | 9,640 |
| Third-party alumina shipments (kmt) | — | — | 8,698 | 9,005 | 8,829 |
| Average realized alumina price (US$/t) | — | — | 358 | 472 | 415 |
| Aluminum production (kmt) | — | — | 2,114 | 2,215 | 2,319 |
| Total aluminum shipments (kmt) | — | — | 2,491 | 2,590 | 2,522 |
| Average realized aluminum price (US$/t) | — | — | 2,828 | 2,841 | 3,376 |
Source: company-reported operating metrics [16] [17] [18] [19]. Click any linked figure to open the filing page with the row highlighted.
Analyst Consensus
Mean target
Median target
High target
Low target
Street ratings: 7 strong buy, 5 hold, 1 sell. Consensus: Buy.
Estimate source: S&P Capital IQ (CapIQ) consensus, as of 2026-08-01. Estimate figures are S&P Capital IQ consensus (vendor data — no filing page links). EPS and net income use the normalized (adjusted) consensus where the street reports it. Line-item analyst models (segments, drivers, KPIs) are in the Visible Alpha tab.
Traceability
333 of 388 figures on this page (86%) link to the filing page where they are printed — click a linked figure to open the source PDF at that page with the row highlighted. Unlinked figures come from standardized data feeds or pre-filing years.
All four core statements and the segment tables for FY2021–FY2025 are taken from Alcoa's own Form 10-K for each fiscal year (FY2025 10-K also supplies the FY2024/FY2023 comparative segment columns).
Display unit is US$ millions, as printed on every statement ('in millions, except per-share amounts').
Revenue by Segment uses Alcoa's reported third-party (external) sales by segment, which reconcile to consolidated Sales via a small 'Other' line (energy/other). FY2021–FY2022 use the recast two-segment presentation (see discrepancies).
Segment Adjusted EBITDA is Alcoa's reported segment profit measure (ASC 280); it is a non-GAAP total that reconciles to consolidated income before income taxes in each 10-K's segment note.
FY2019–FY2020 long-term figures are comparative columns of the FY2021 Form 10-K; FY2016–FY2018 are from the standardized SEC XBRL data feed and are shown without page links.
Capital expenditures are shown as printed in the cash-flow statement (negative = cash outflow).
Quarterly block: standalone quarters as printed in each 10-Q; Q4 FY2025 has no standalone filing and is omitted. Quarterly cash-flow statement omitted this run.
Feed vs filing: reported revenue, net income attributable to Alcoa, operating cash flow, capex and total liabilities agree with the filings for FY2021–FY2025 (no rounding-level conflicts); the only material reconciliation item is the FY2023 segment recast noted above.
3 figure(s) differed between the data feed and the filing; the filing value is shown (see the run's metrics/metrics_tab.json for the audit trail).
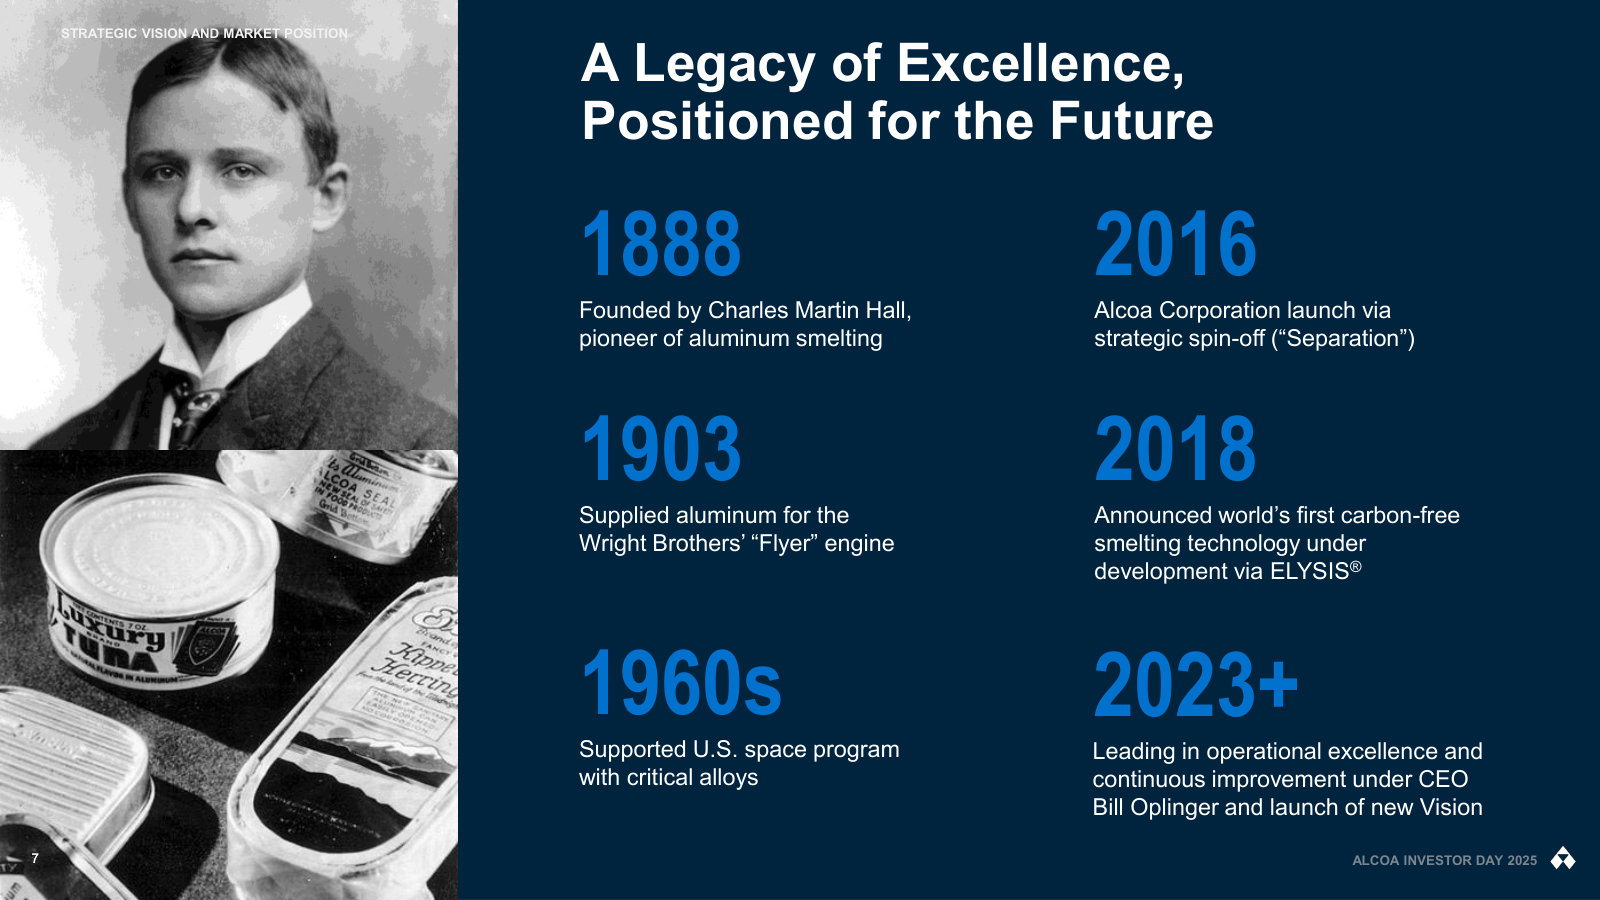
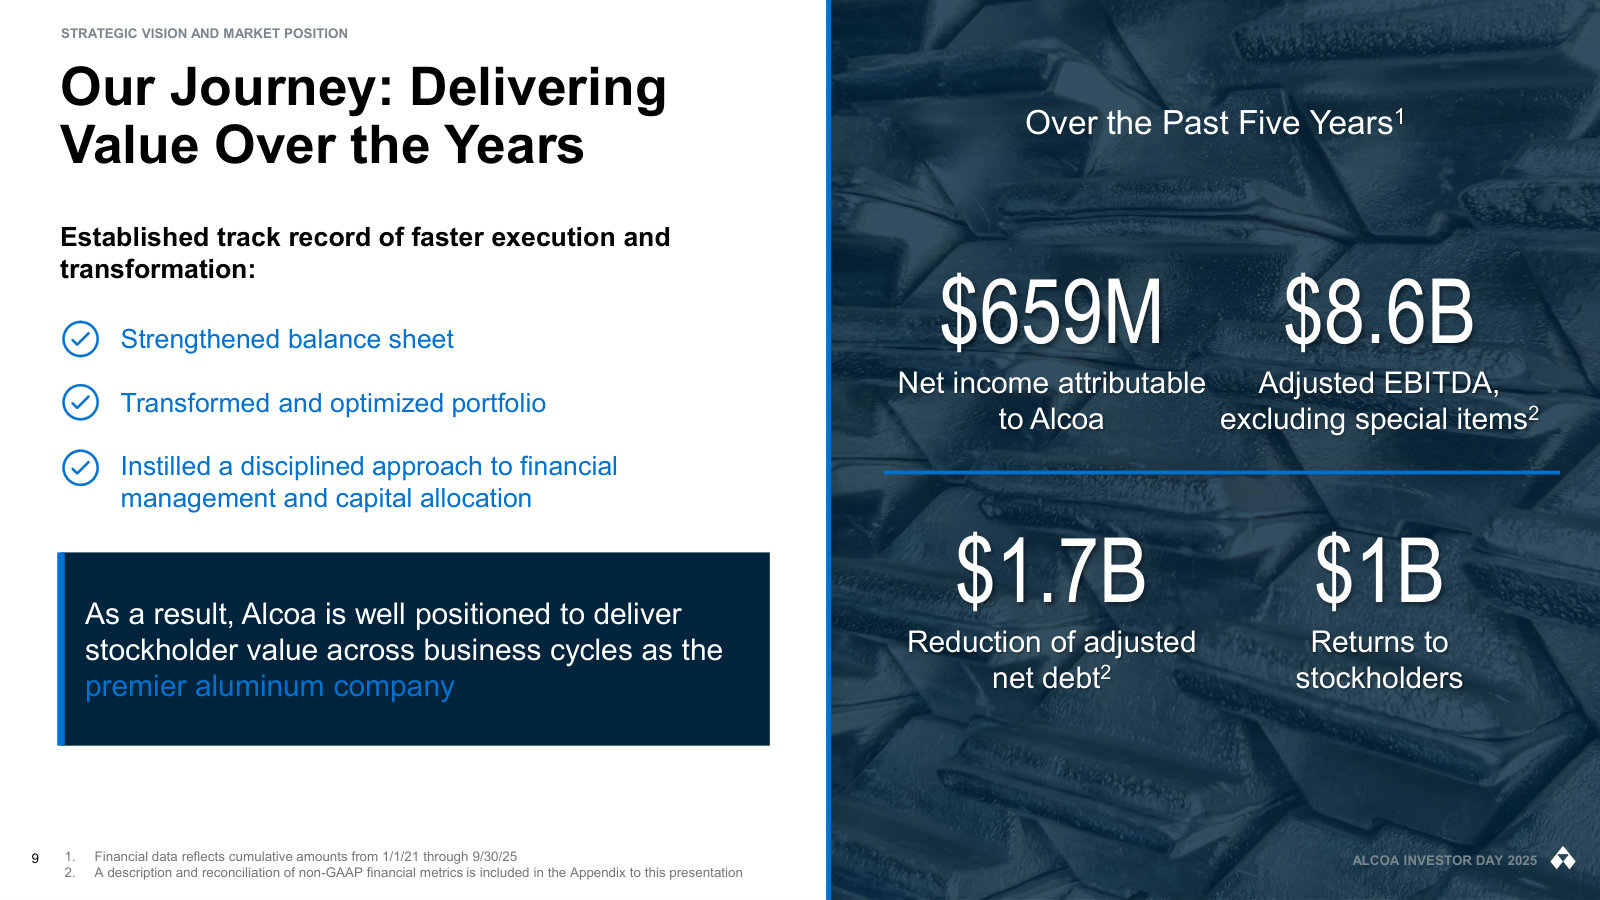
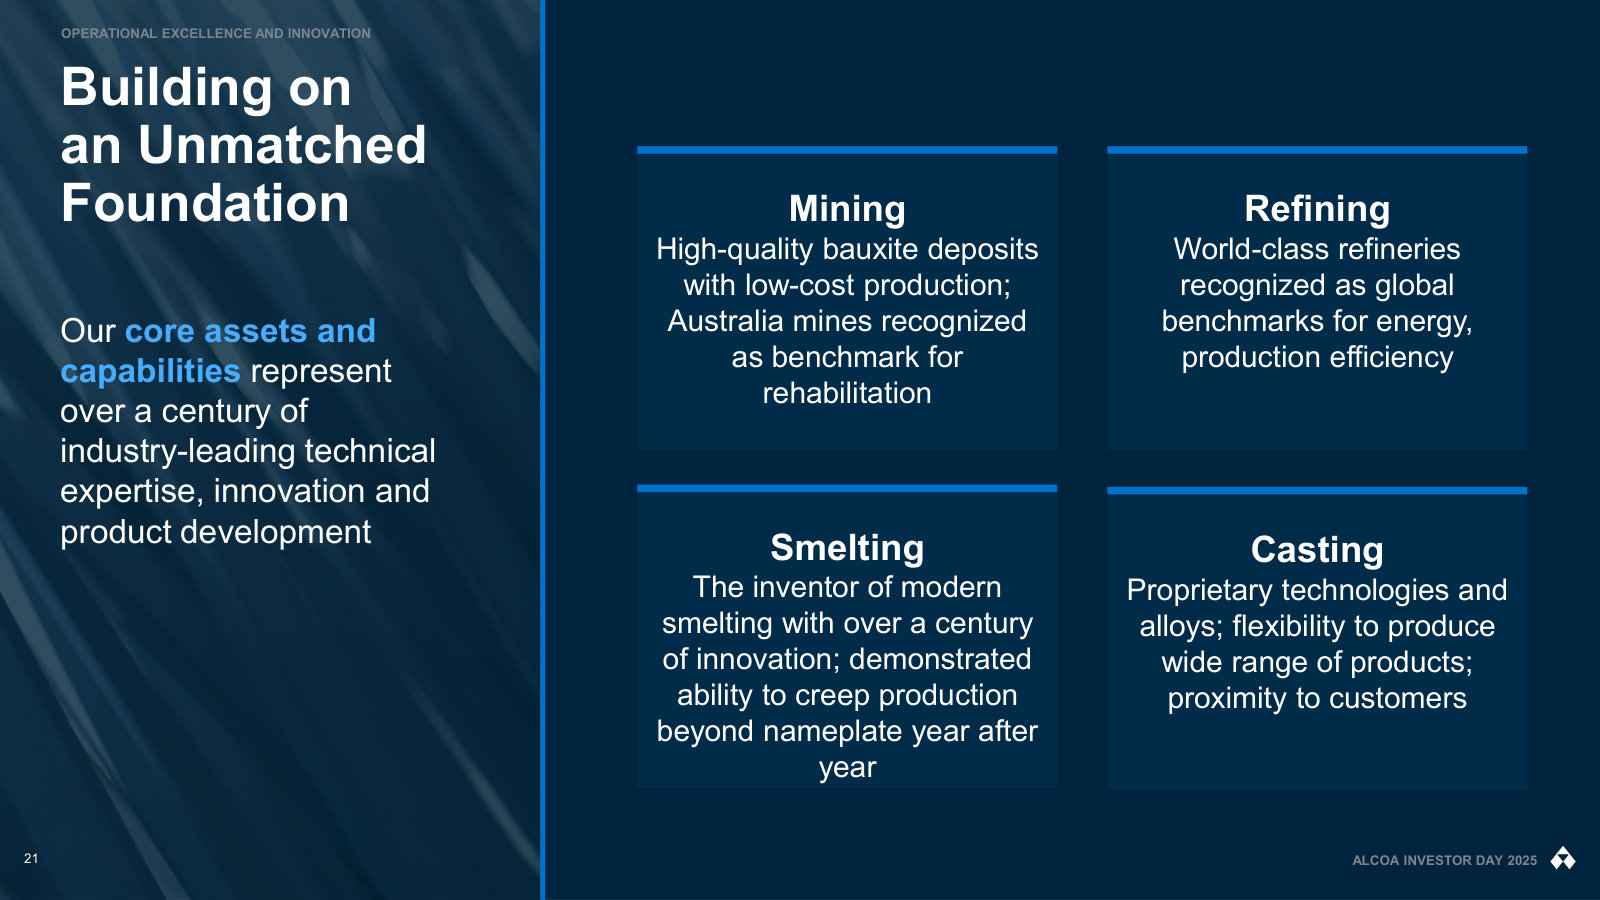
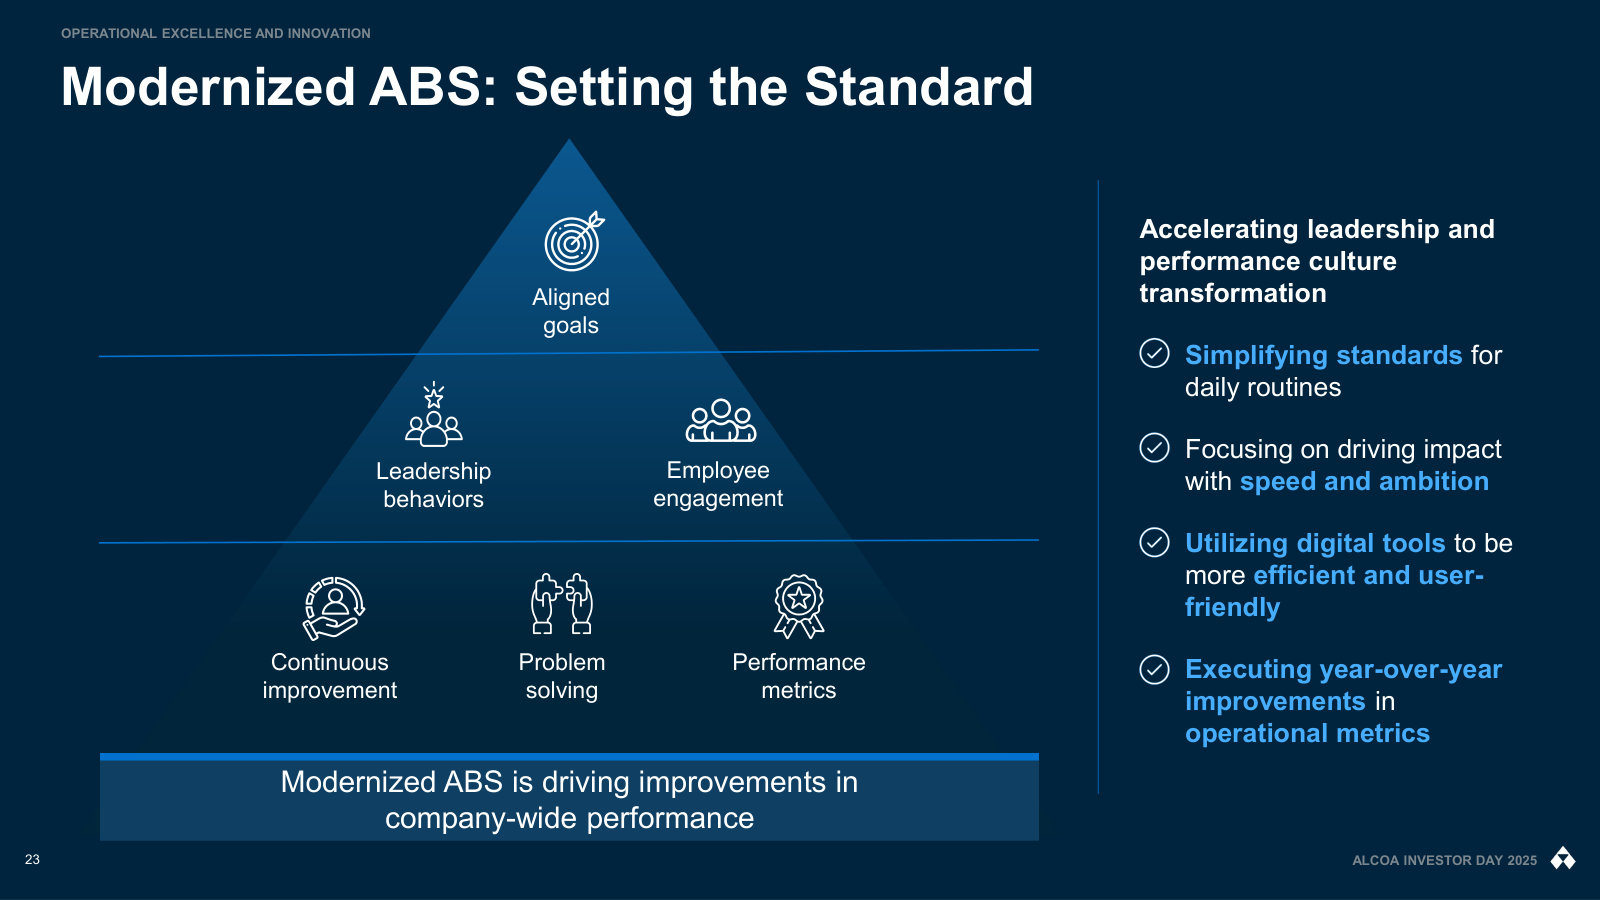
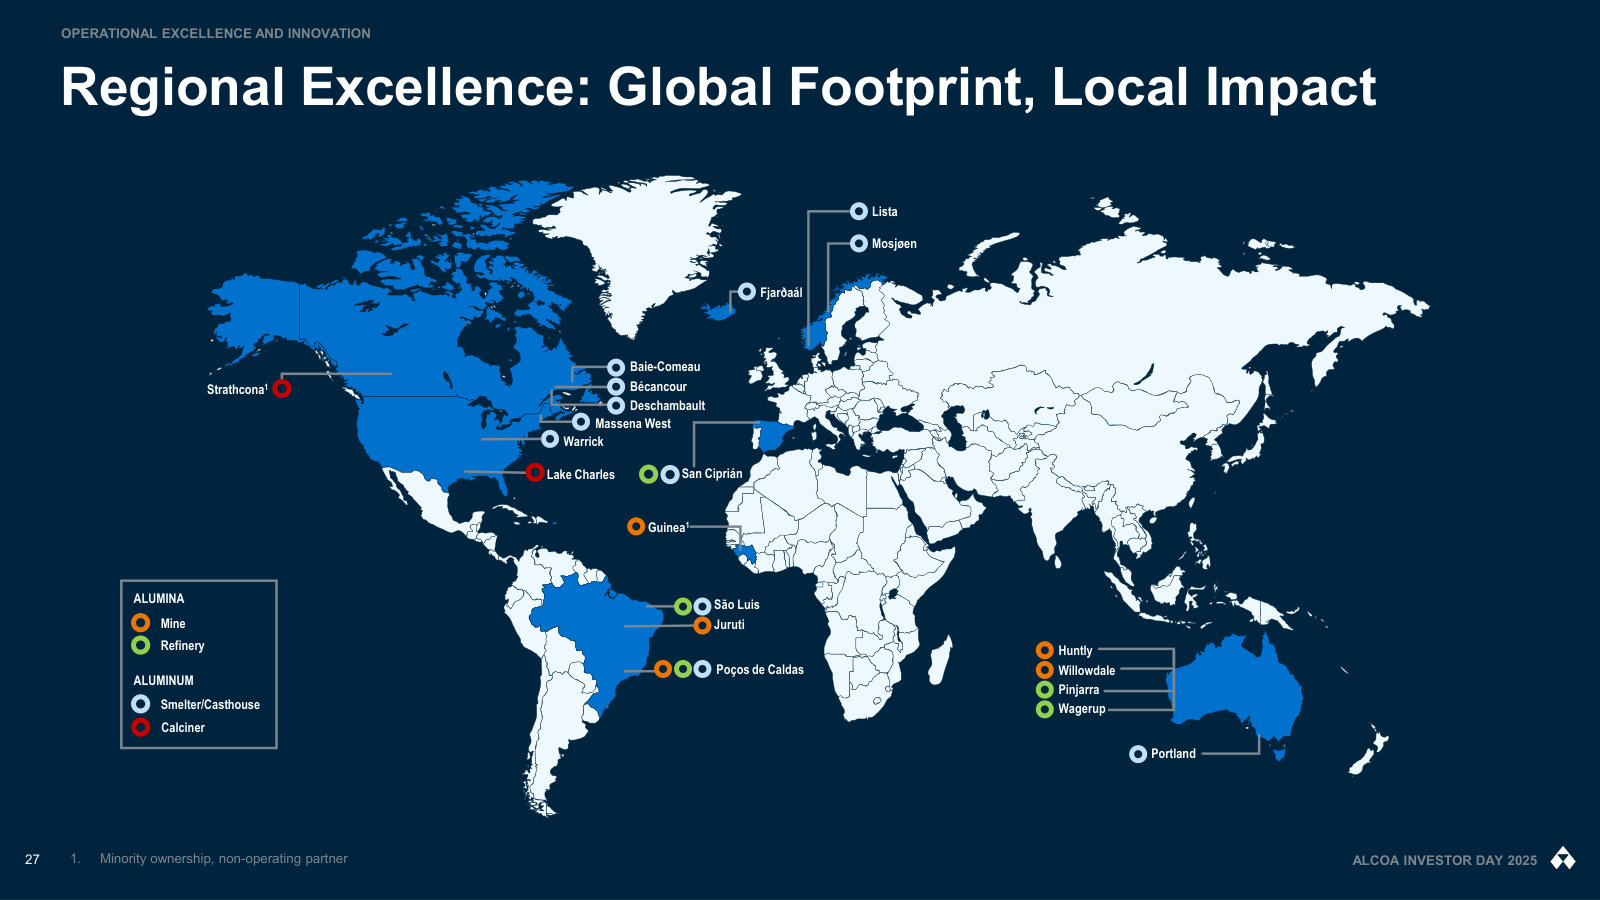
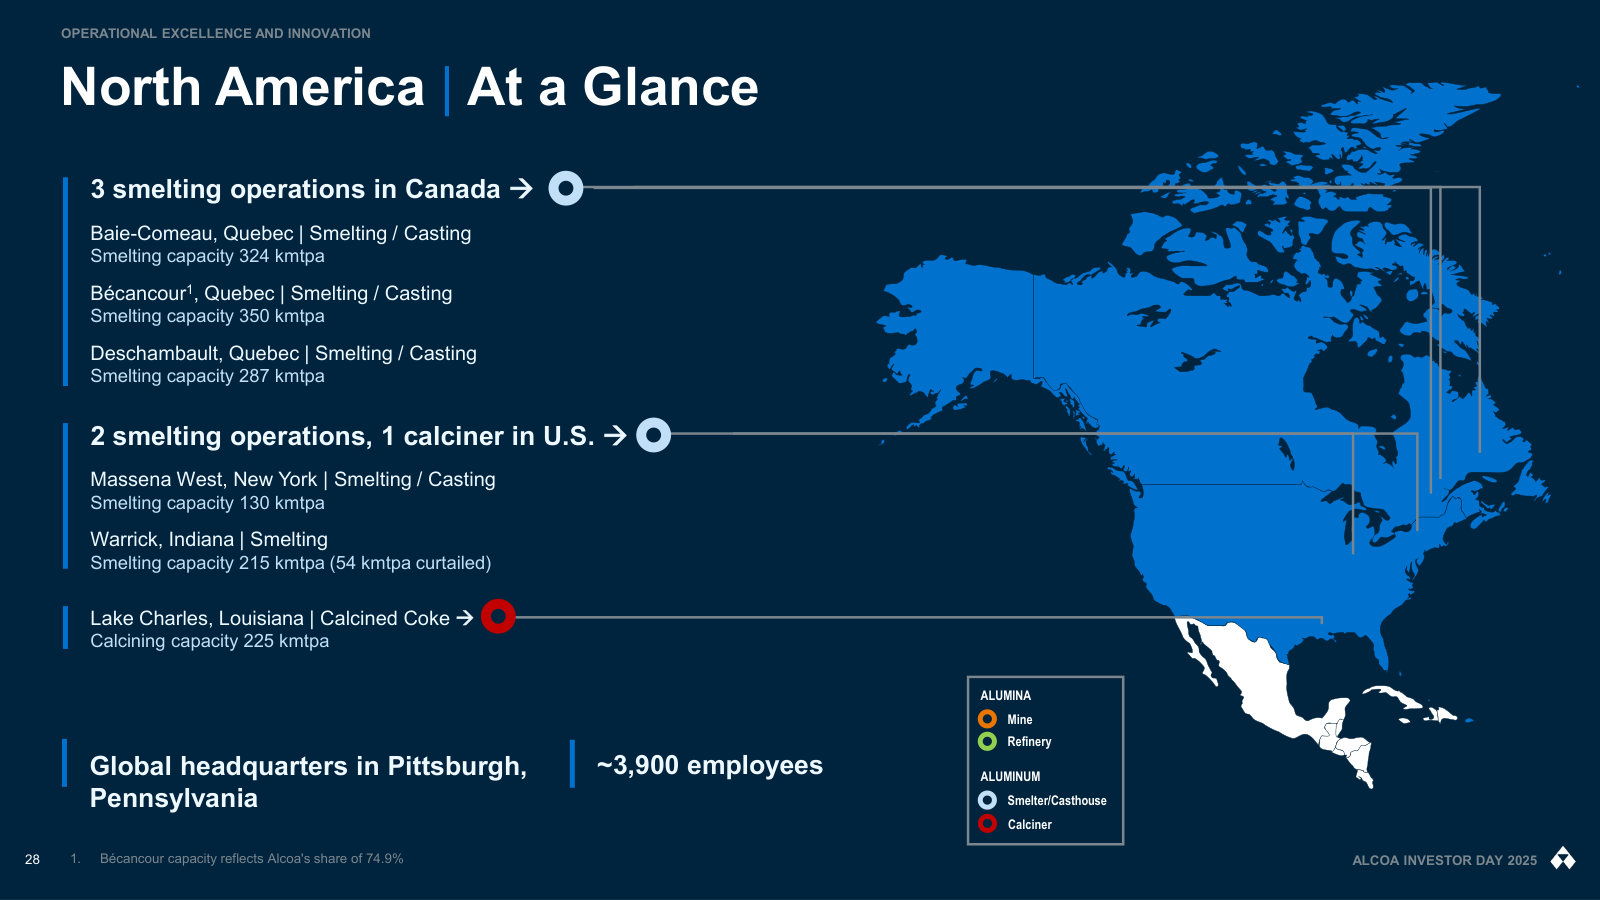
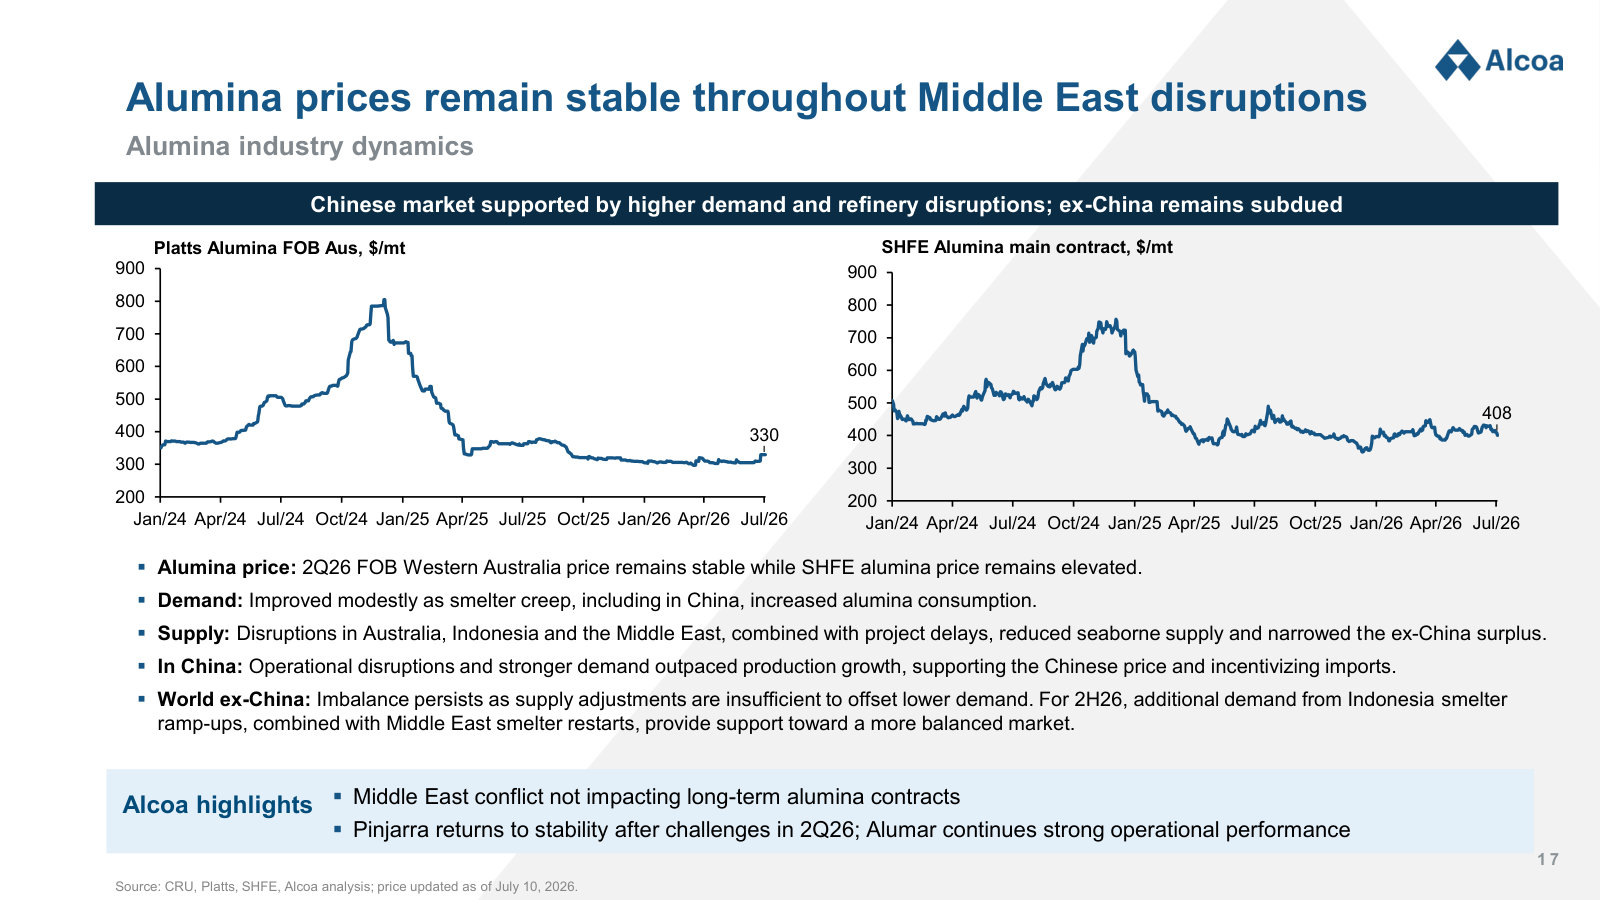
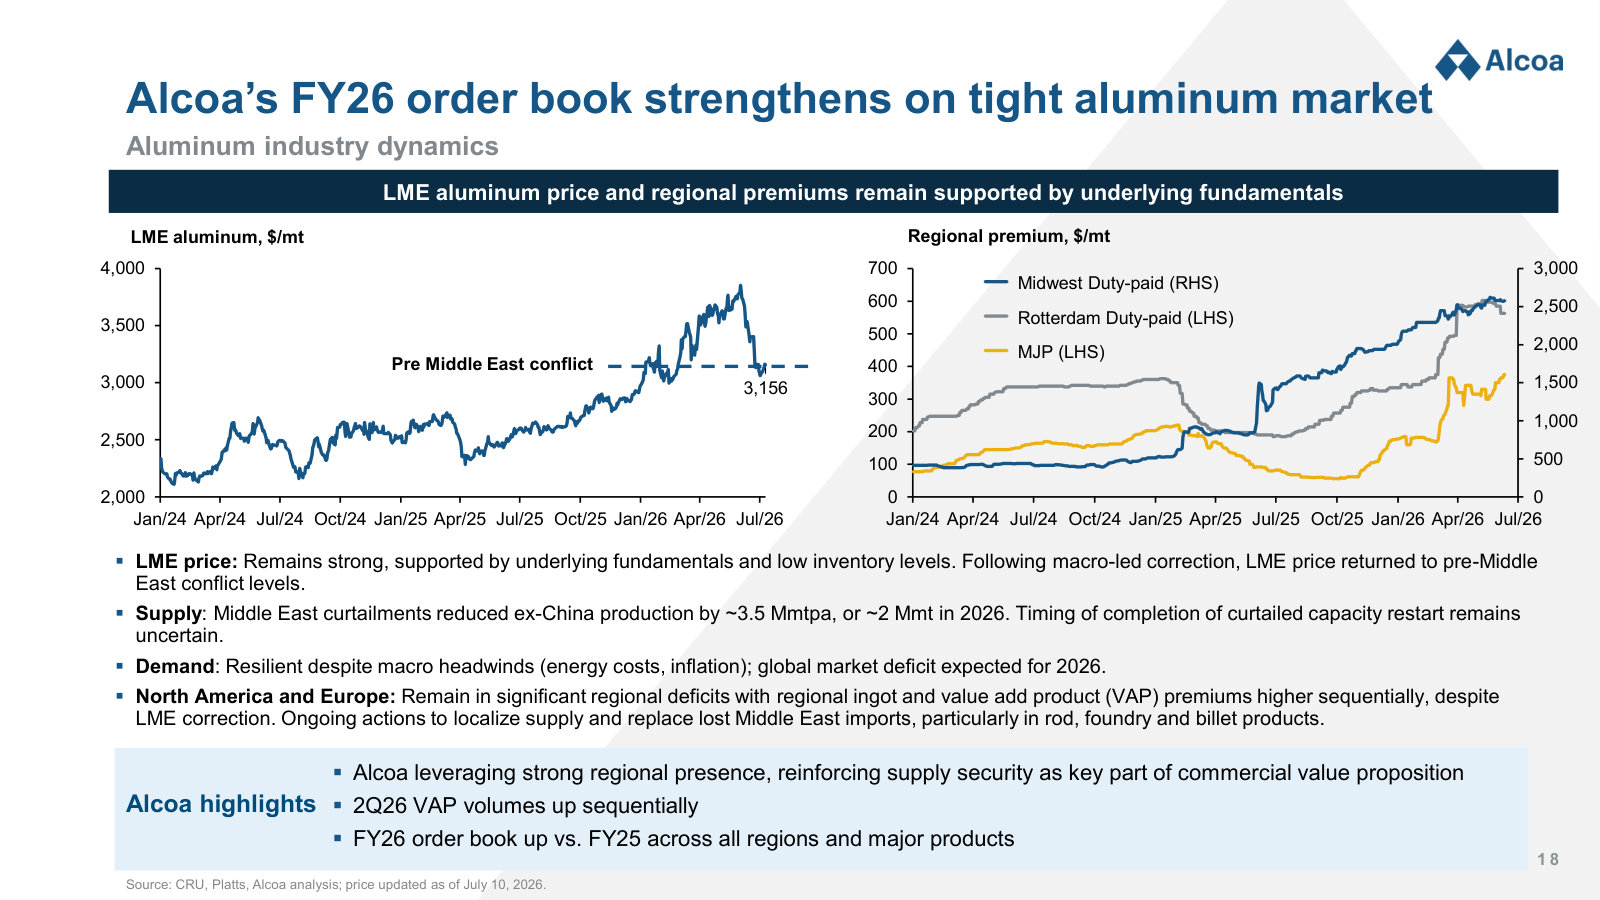
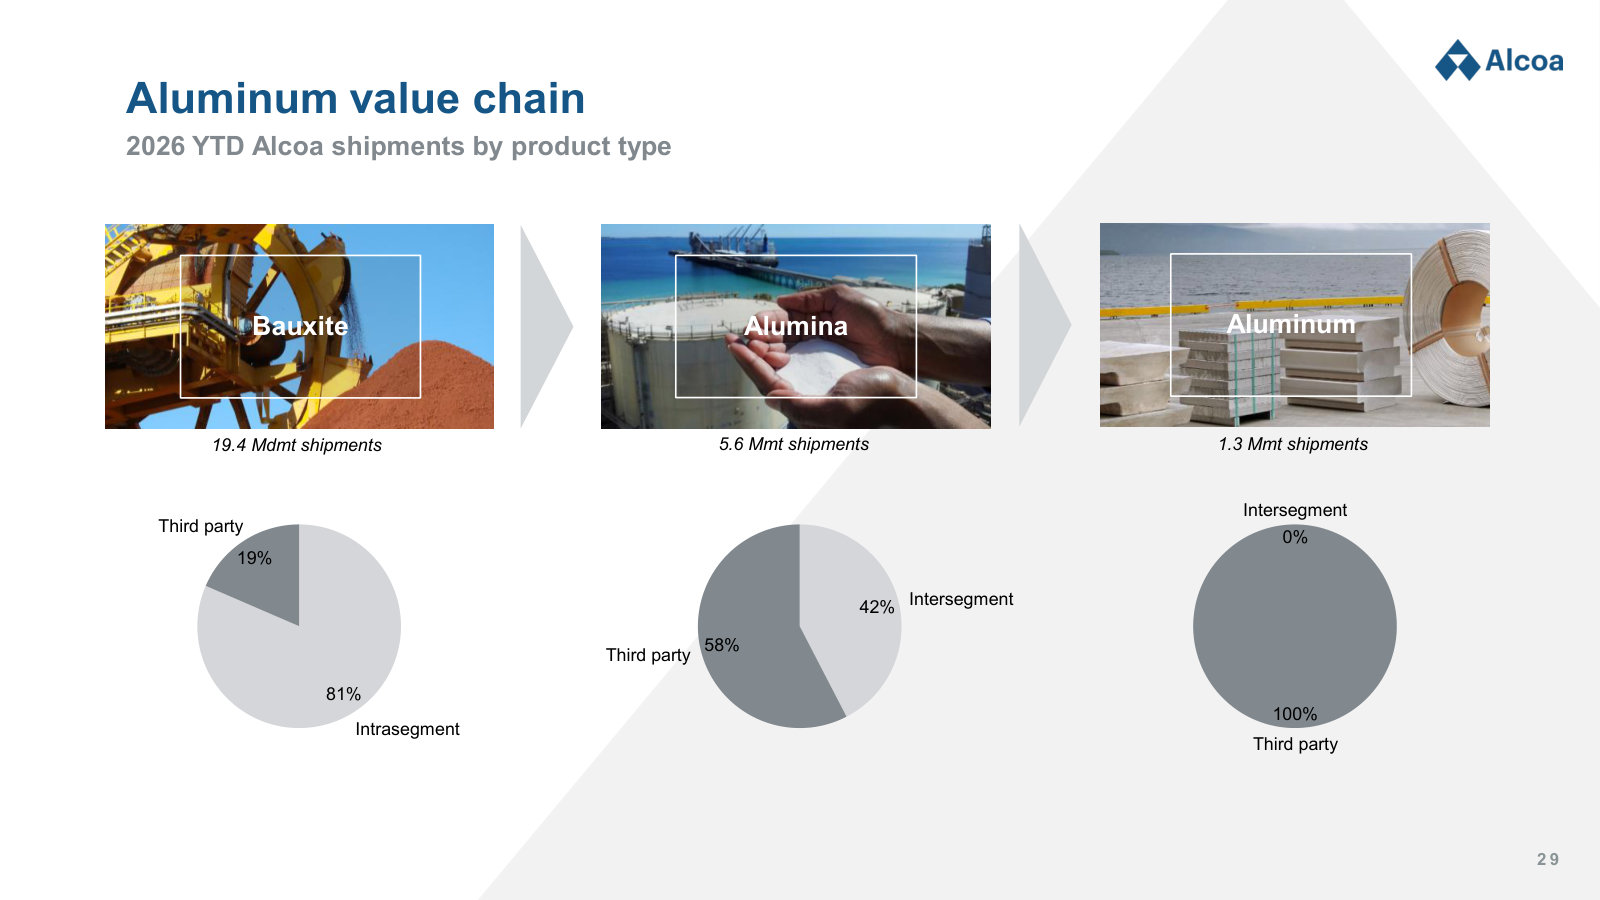
Alcoa Corporation's management explains the business in its own materials. The slides below do the most of that work, pulled from the documents preserved in Sources. Each source link opens the complete presentation at that slide in a new tab.
Investor Day 2025 — 2025
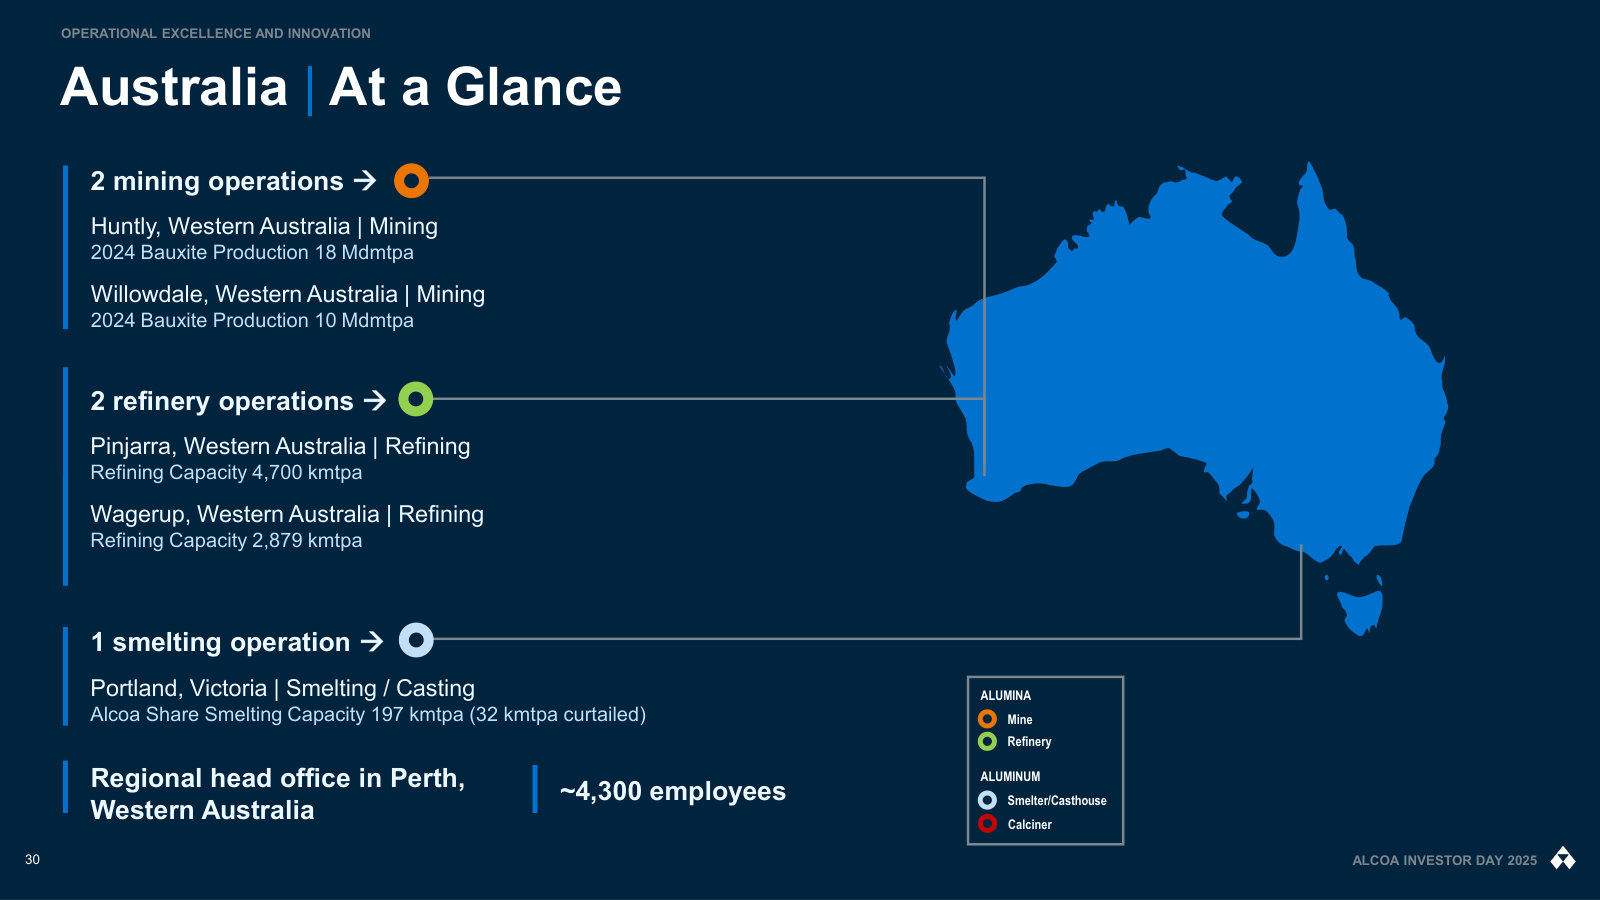
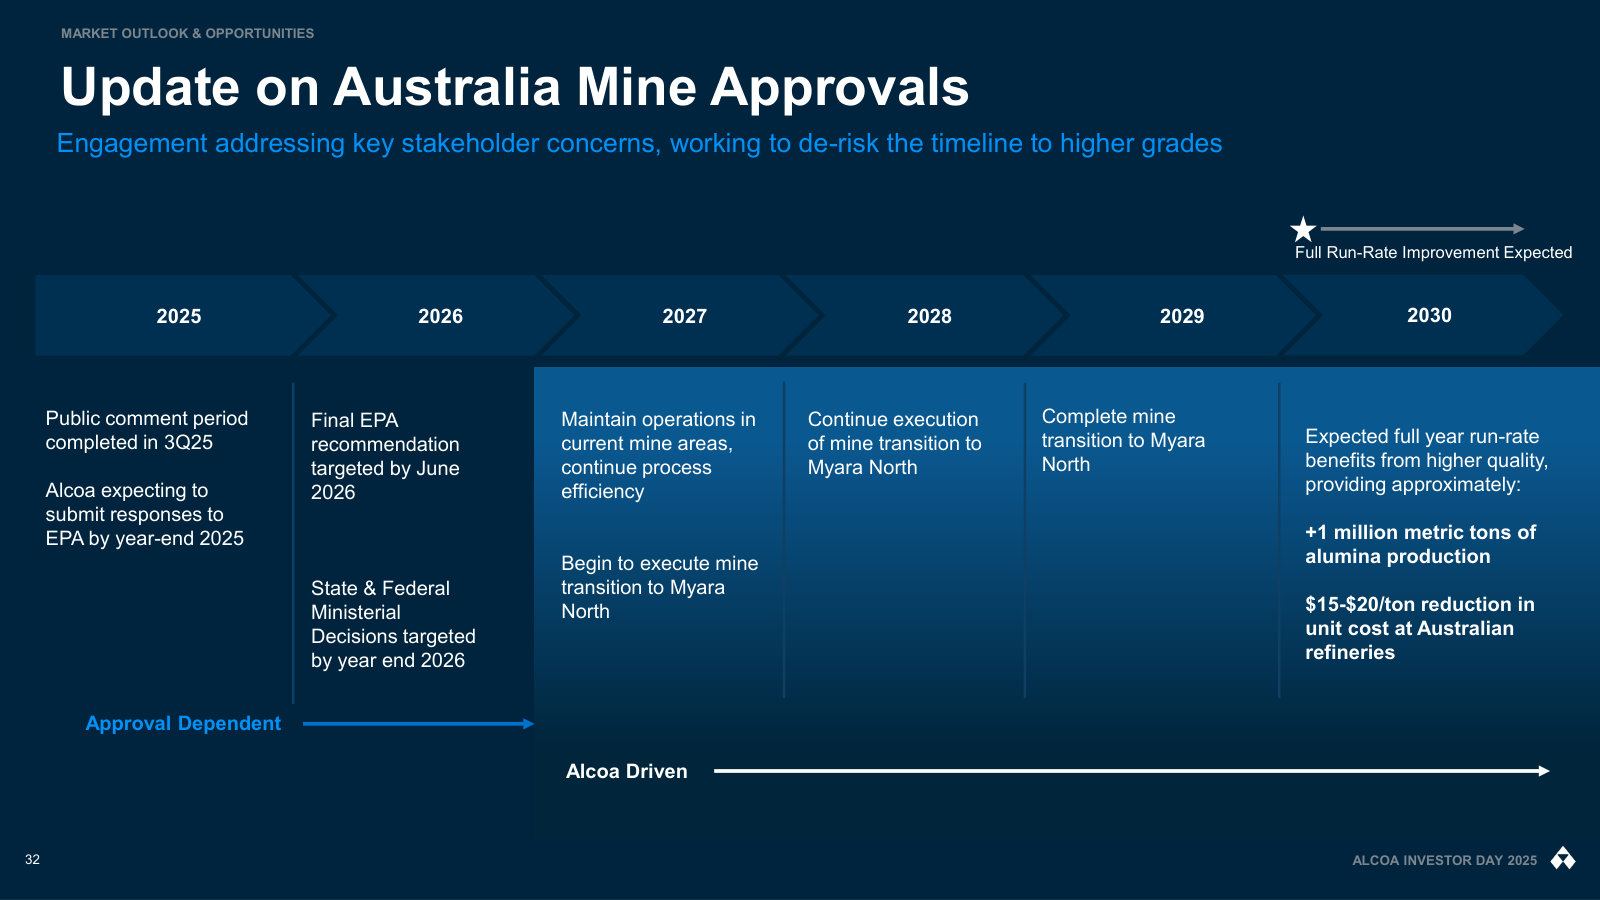
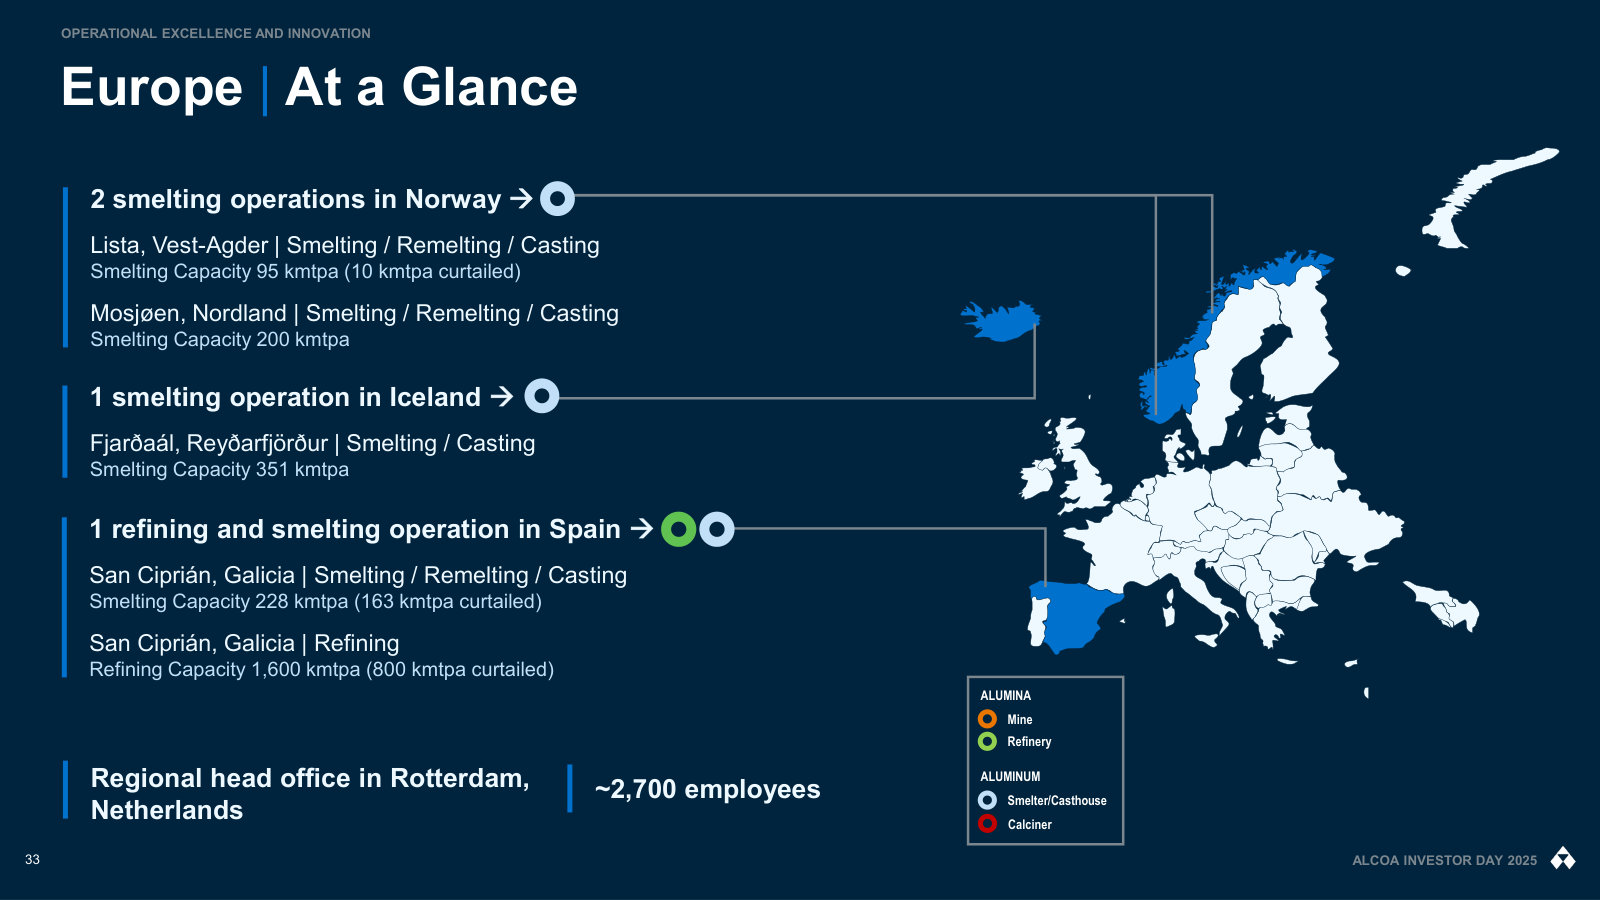
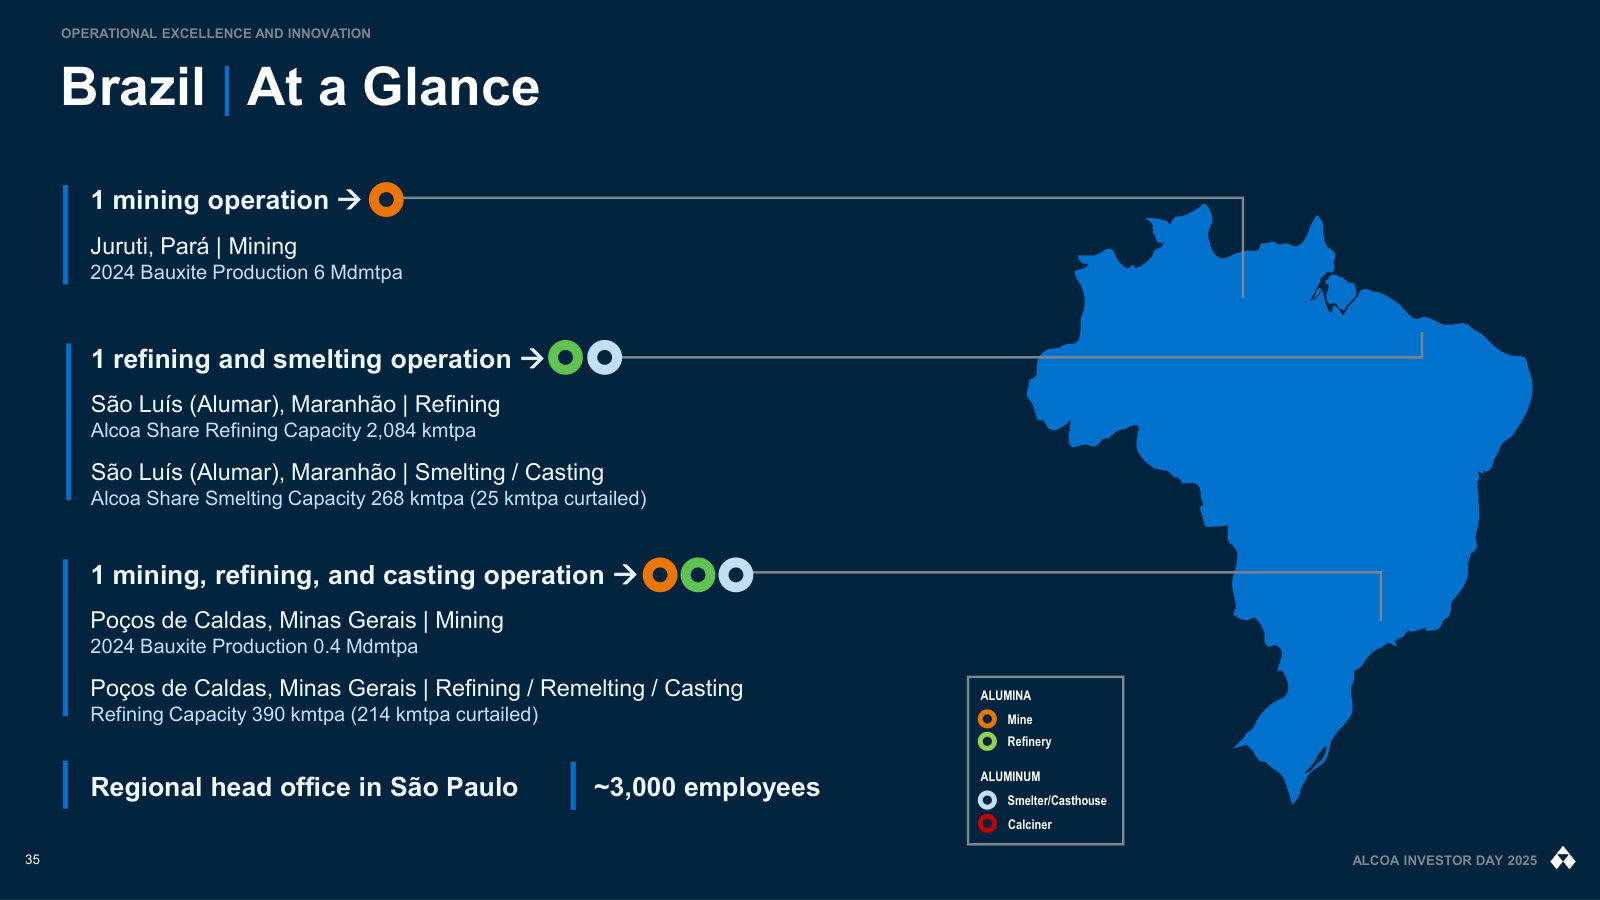
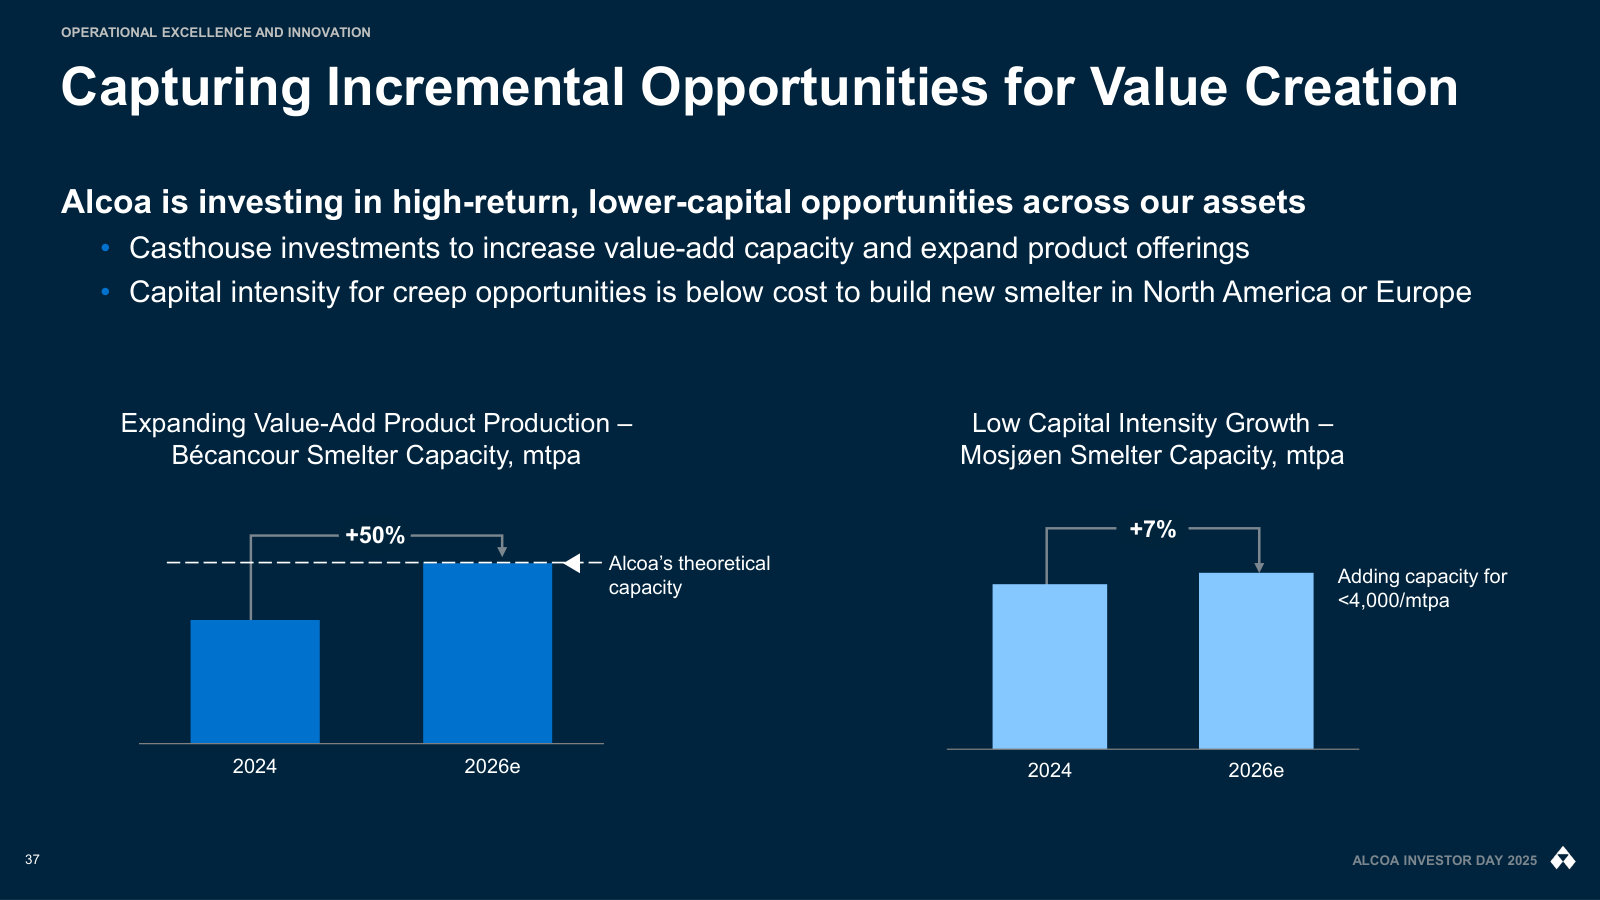
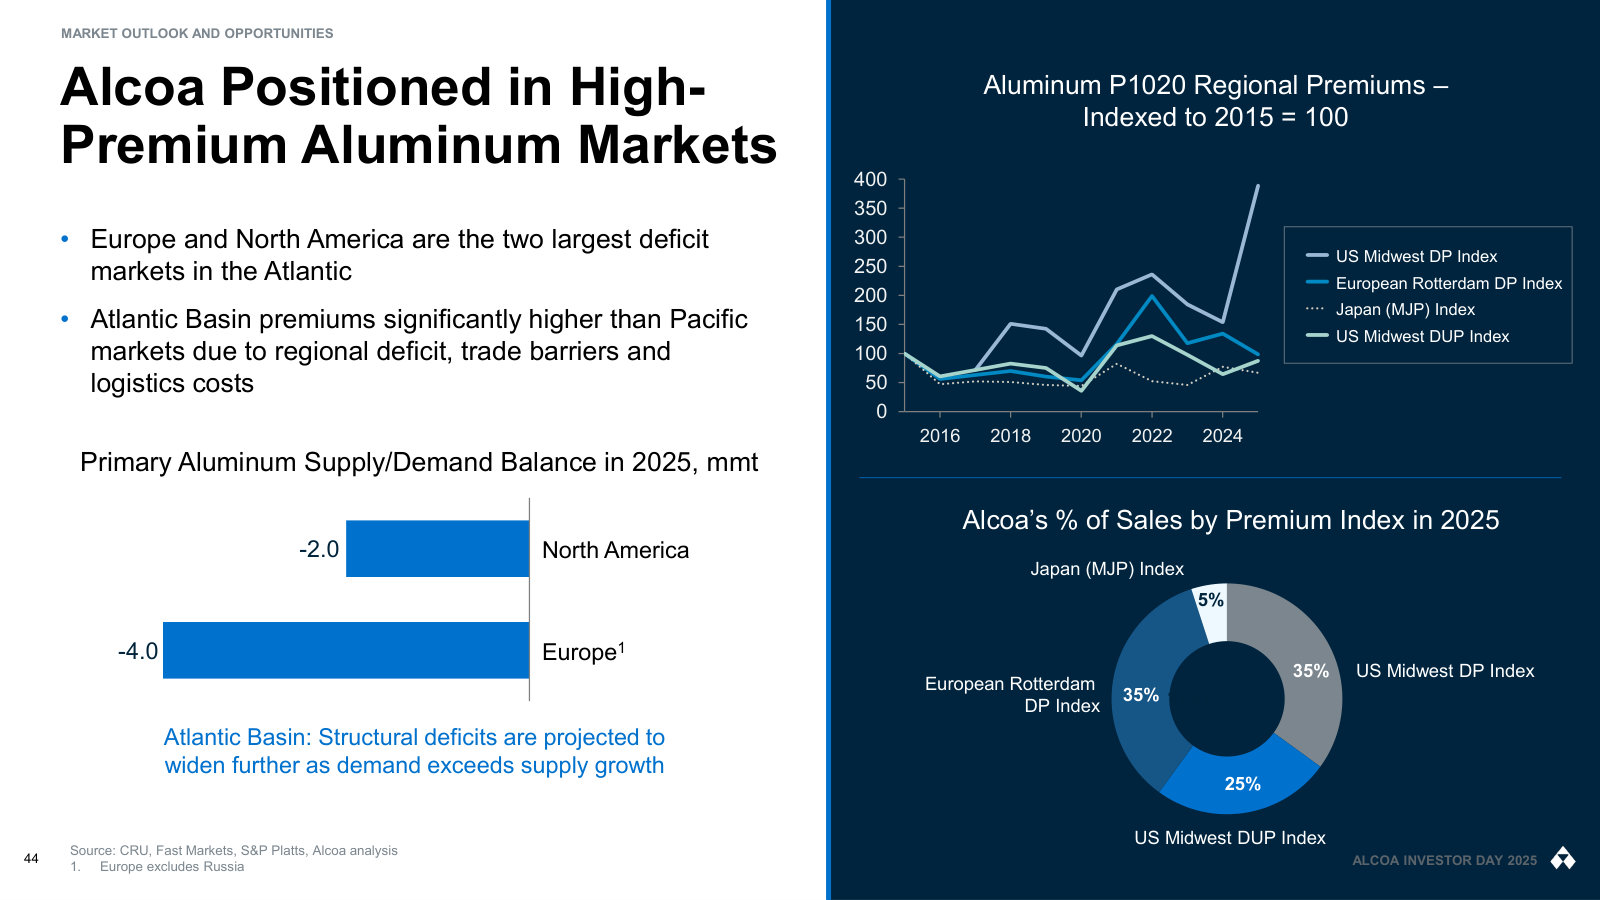
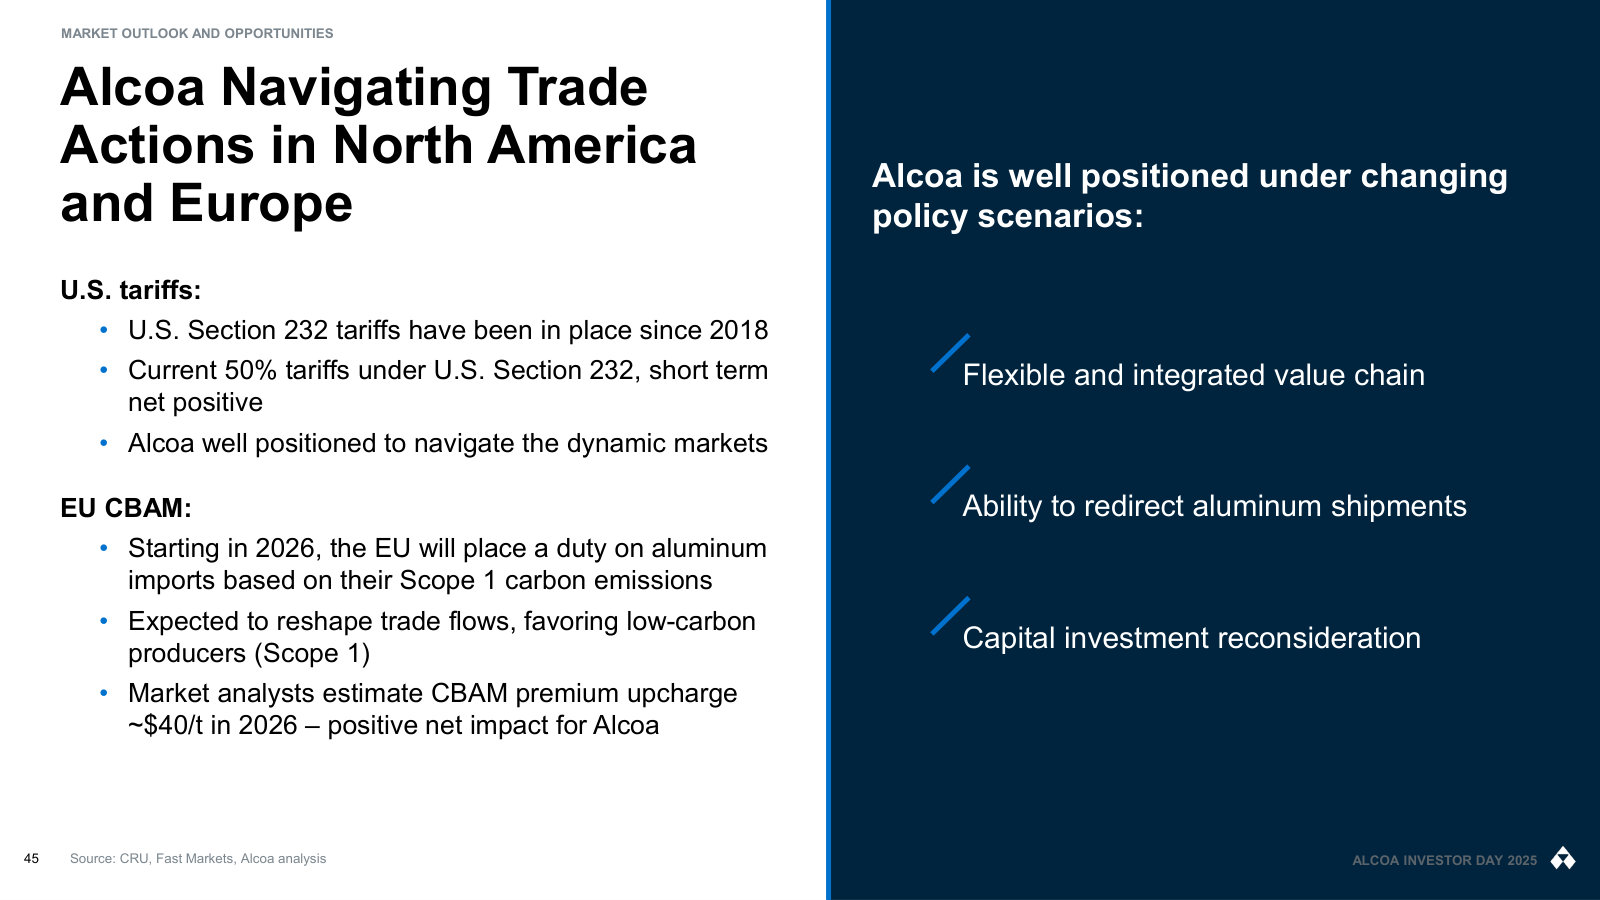
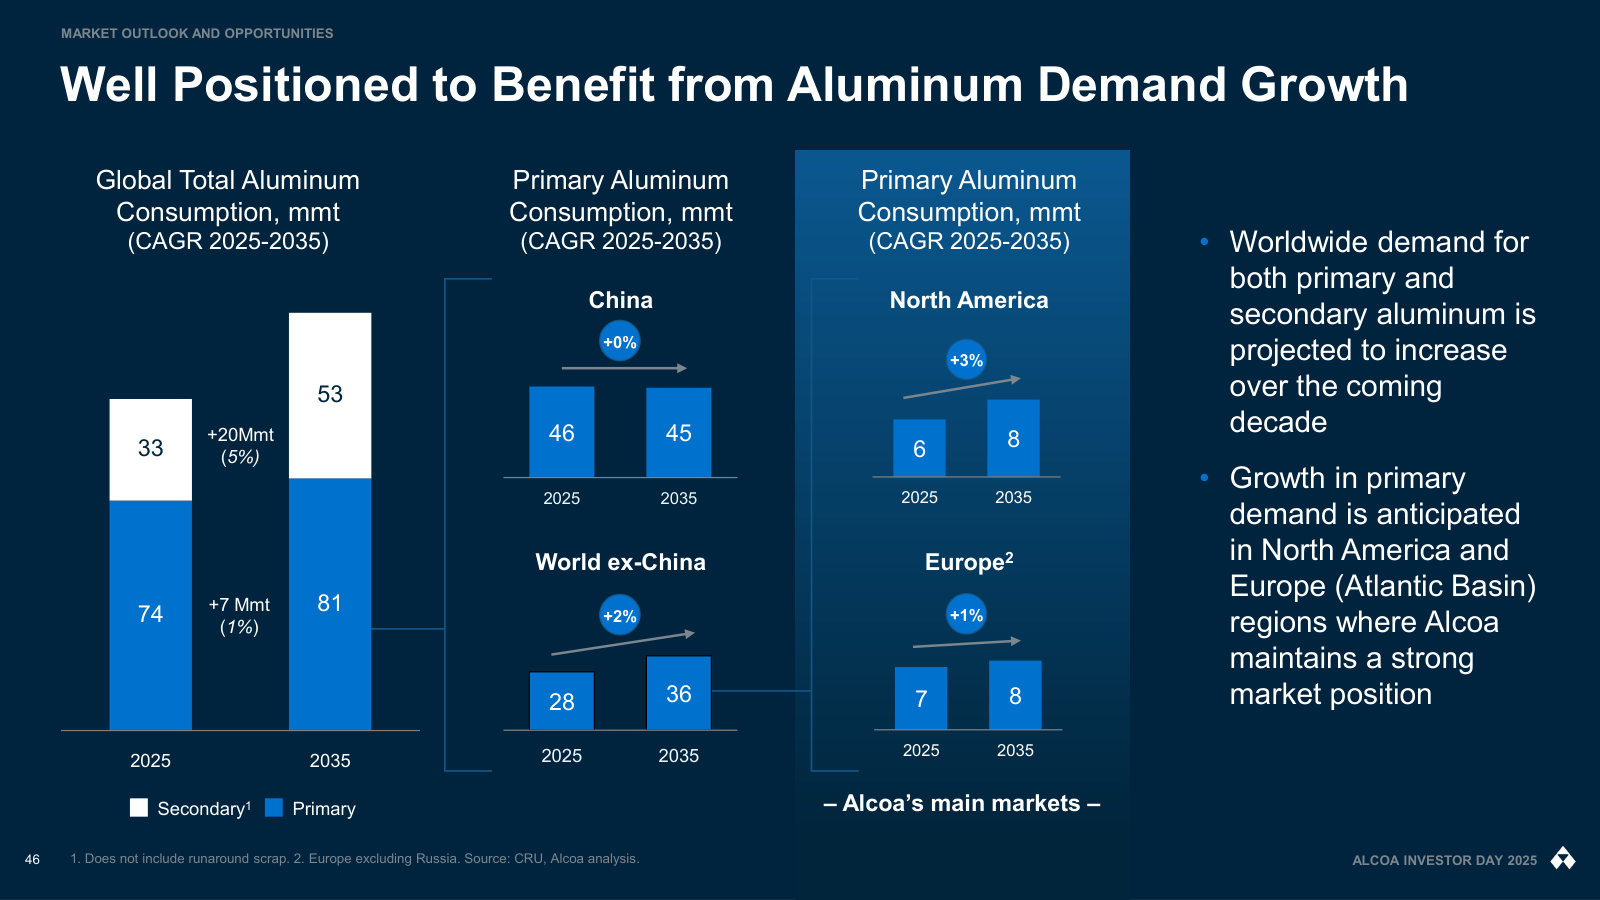
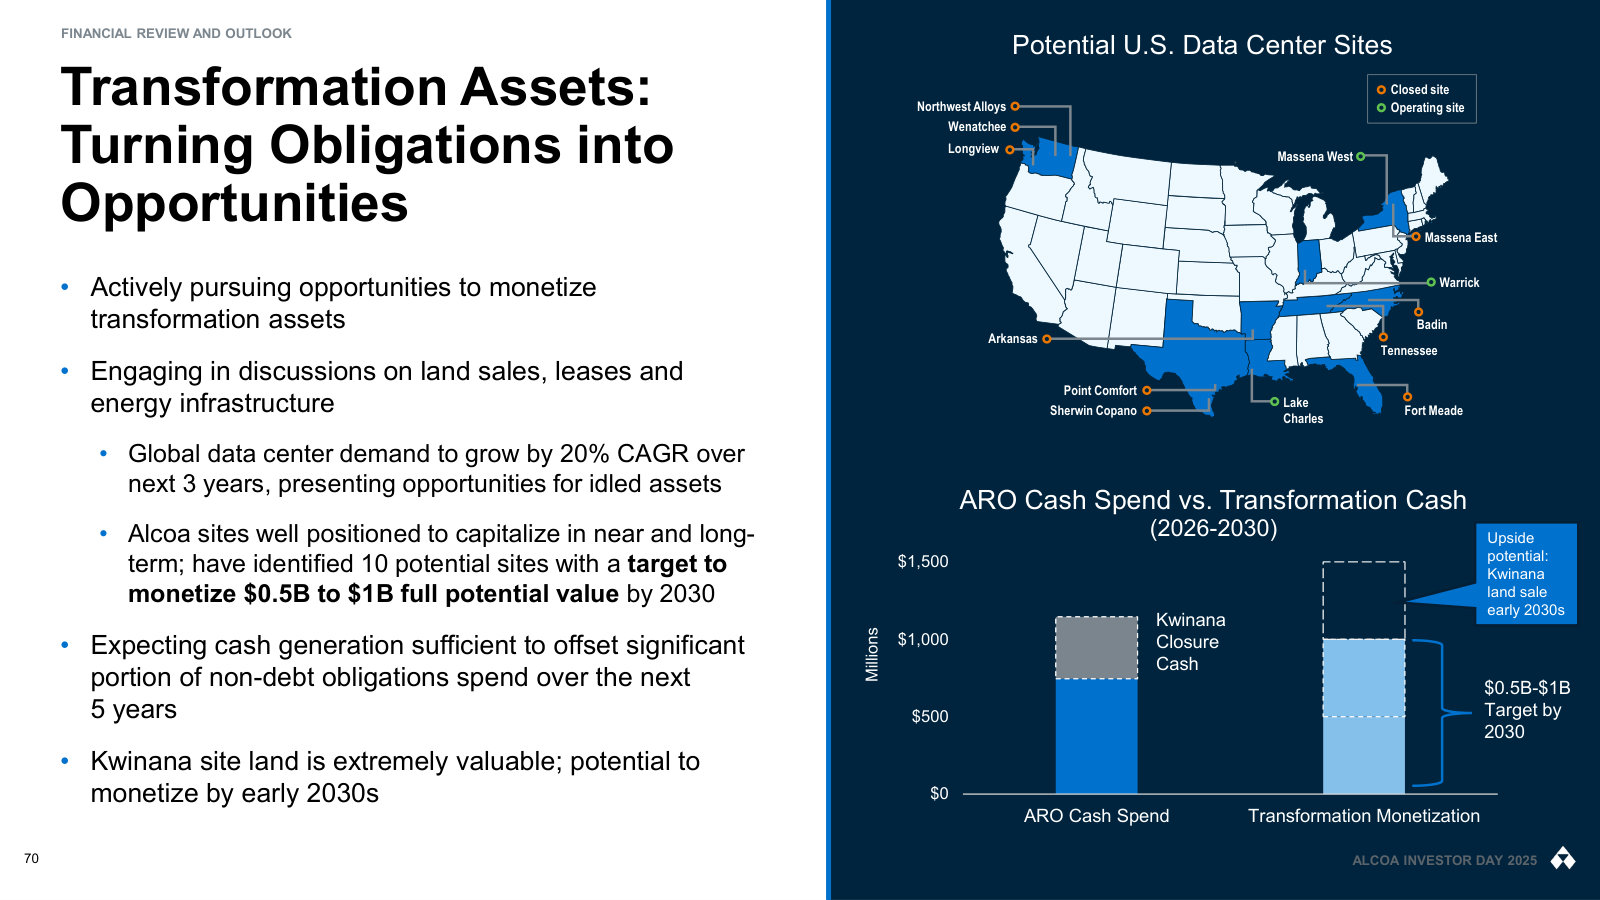
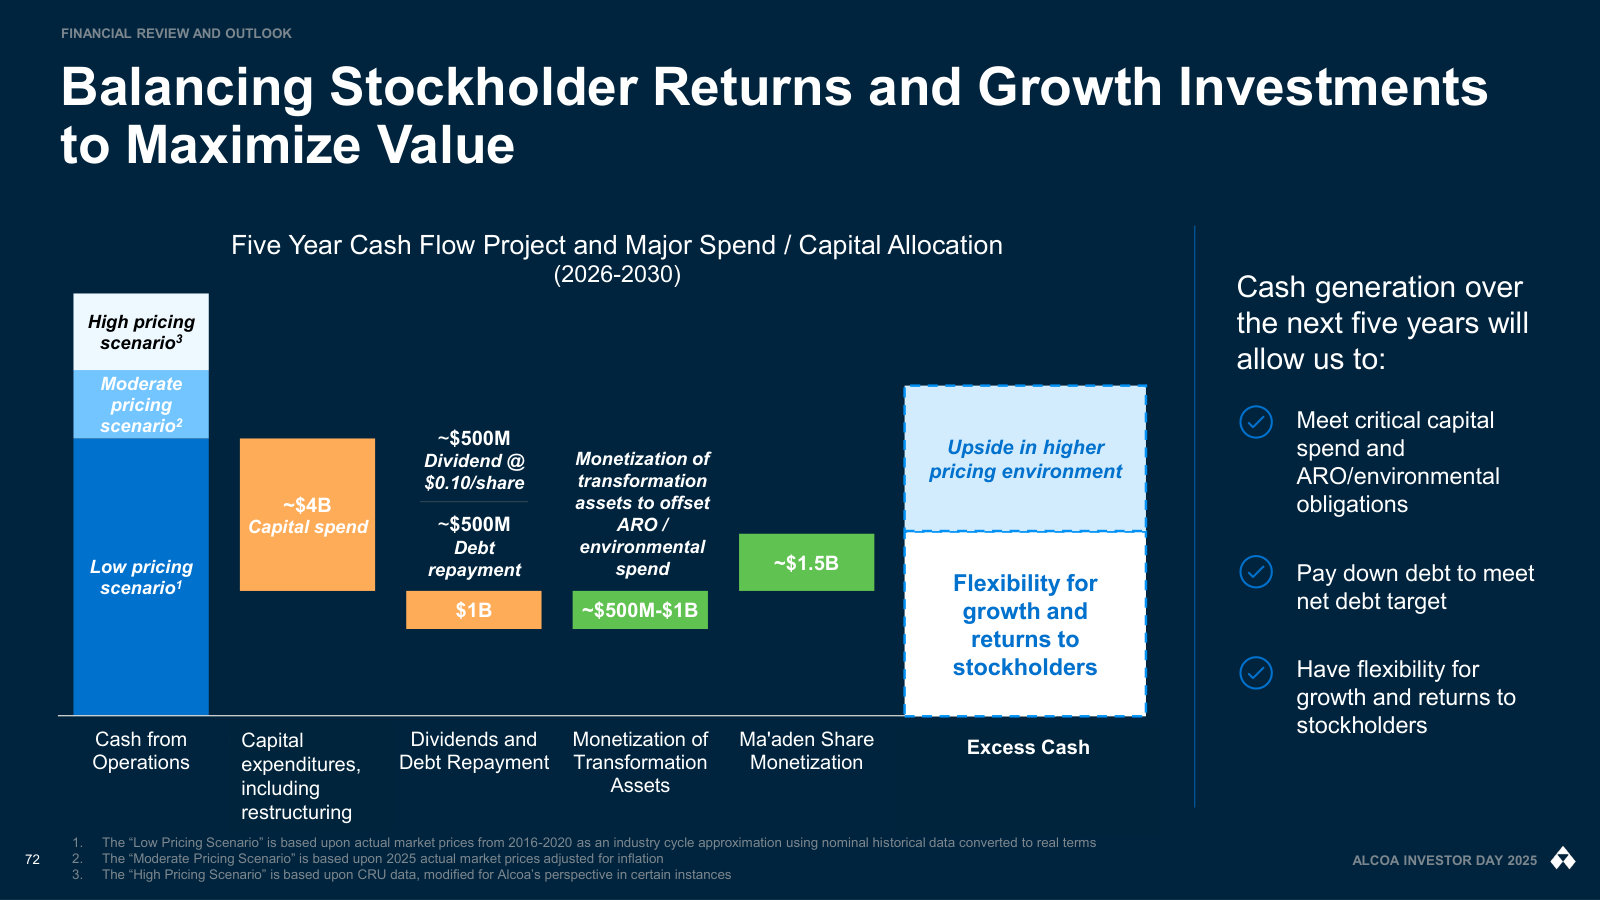
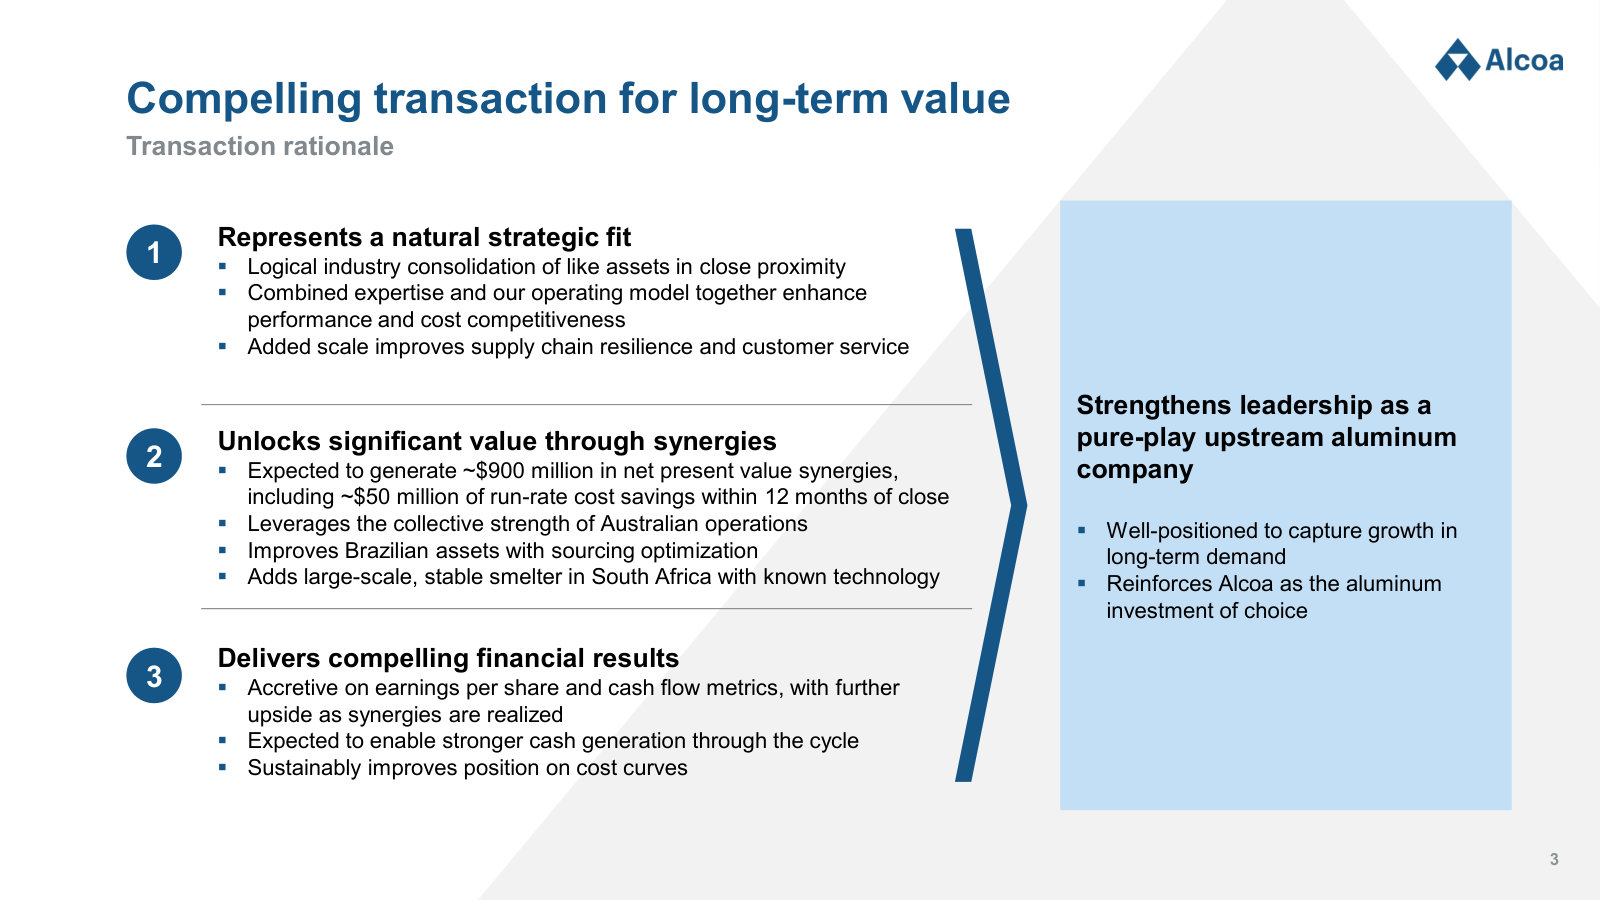
Management's fullest statement of the business — assets, cost position, segments, geography, market outlook and capital plan. · Open the full document →
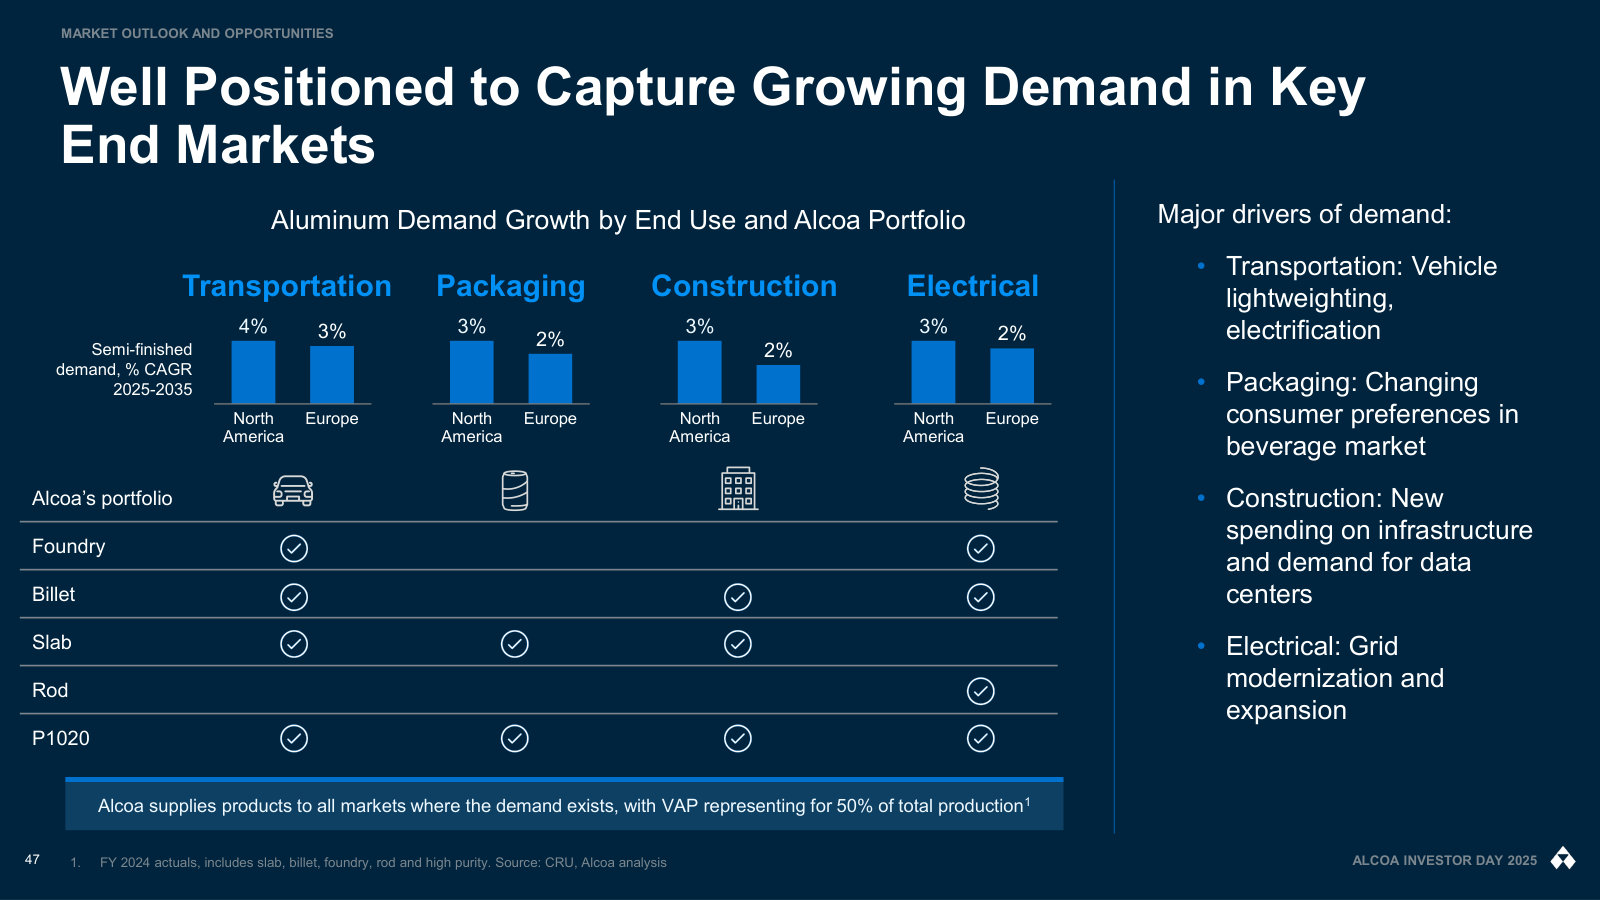
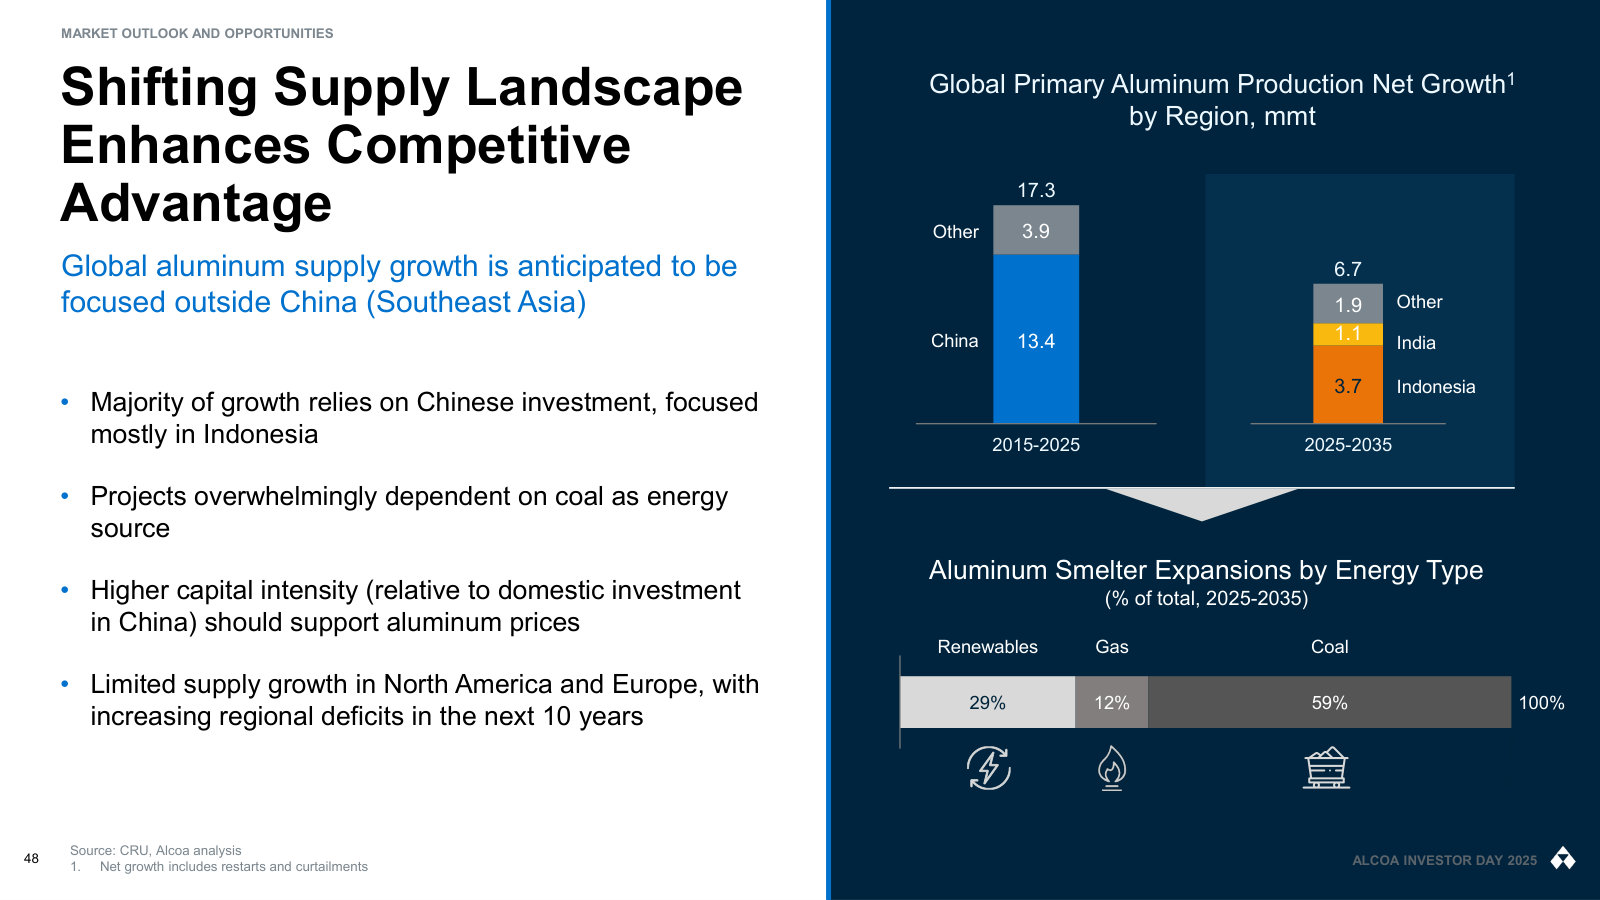
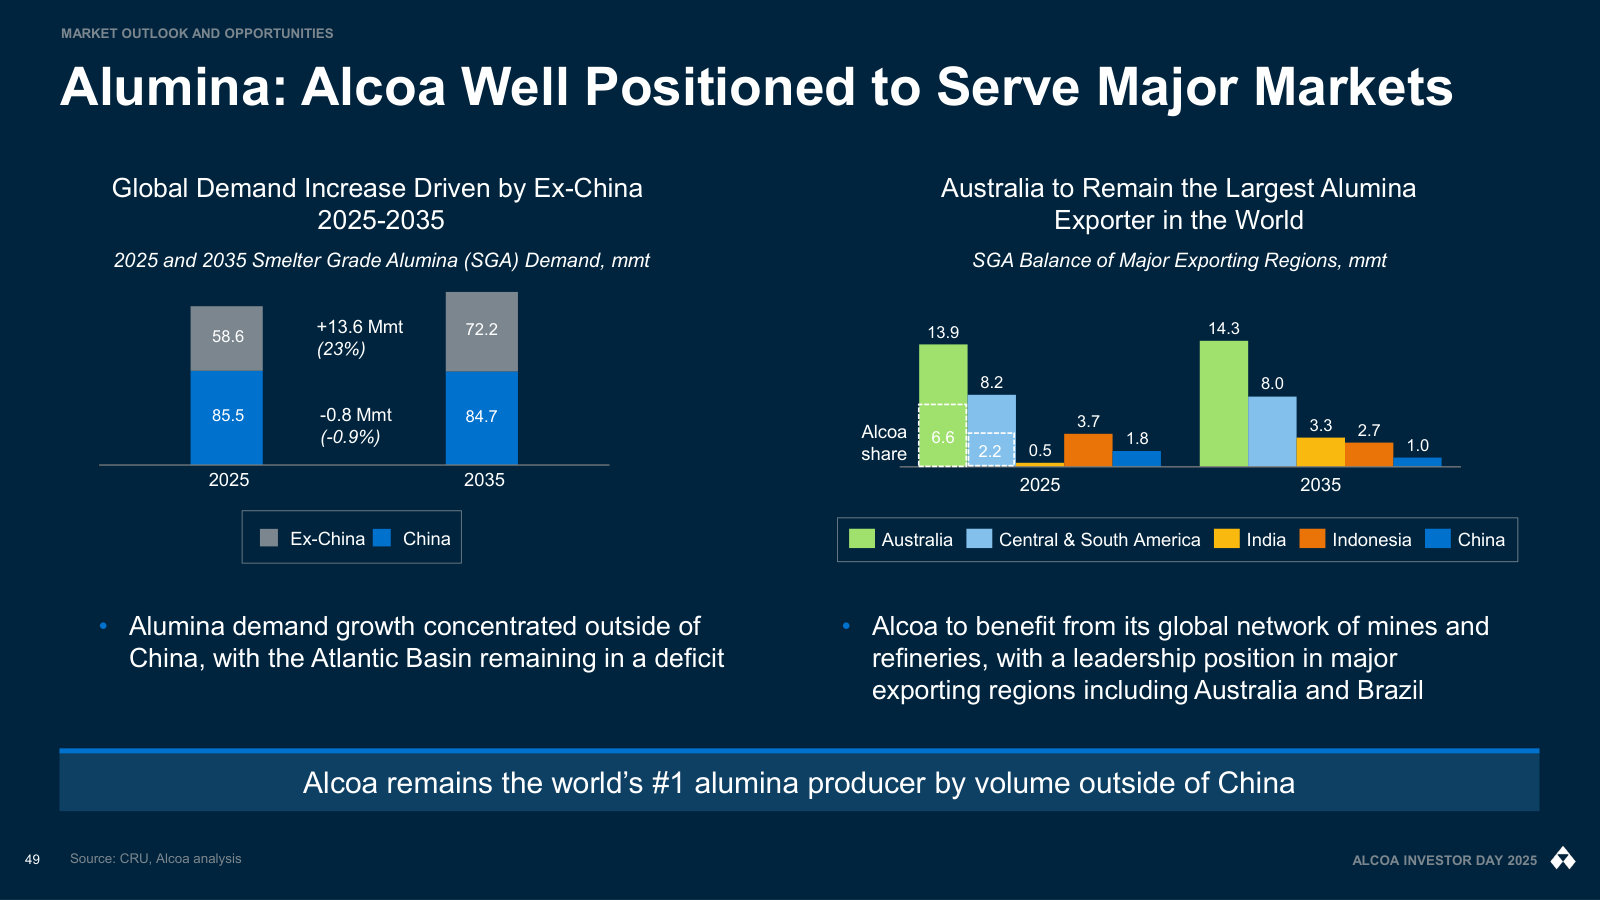
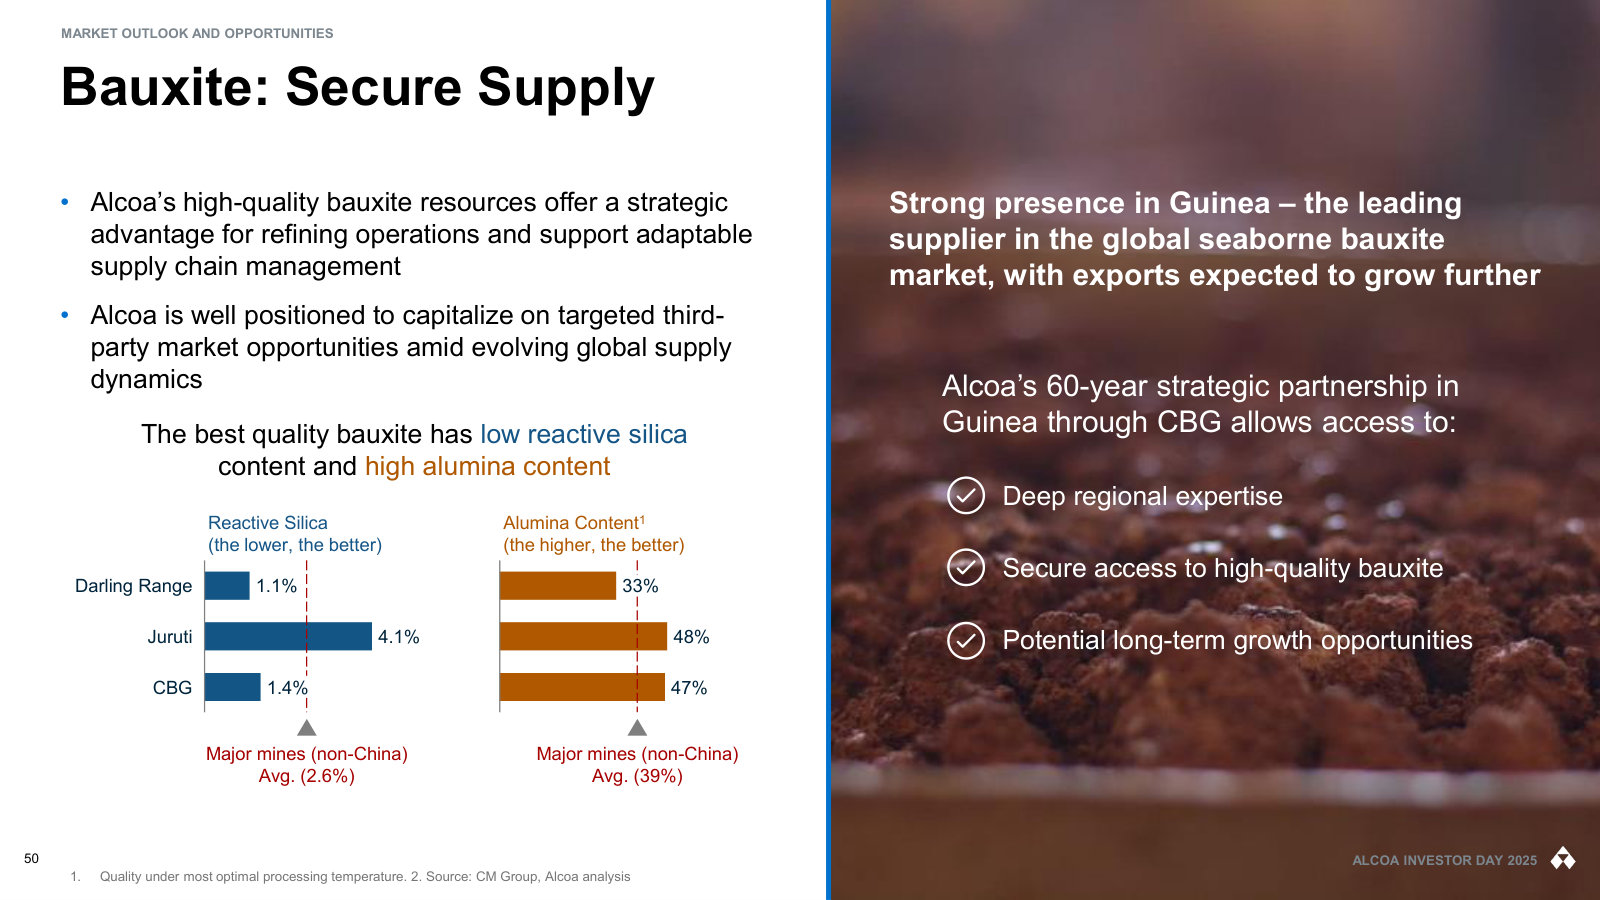
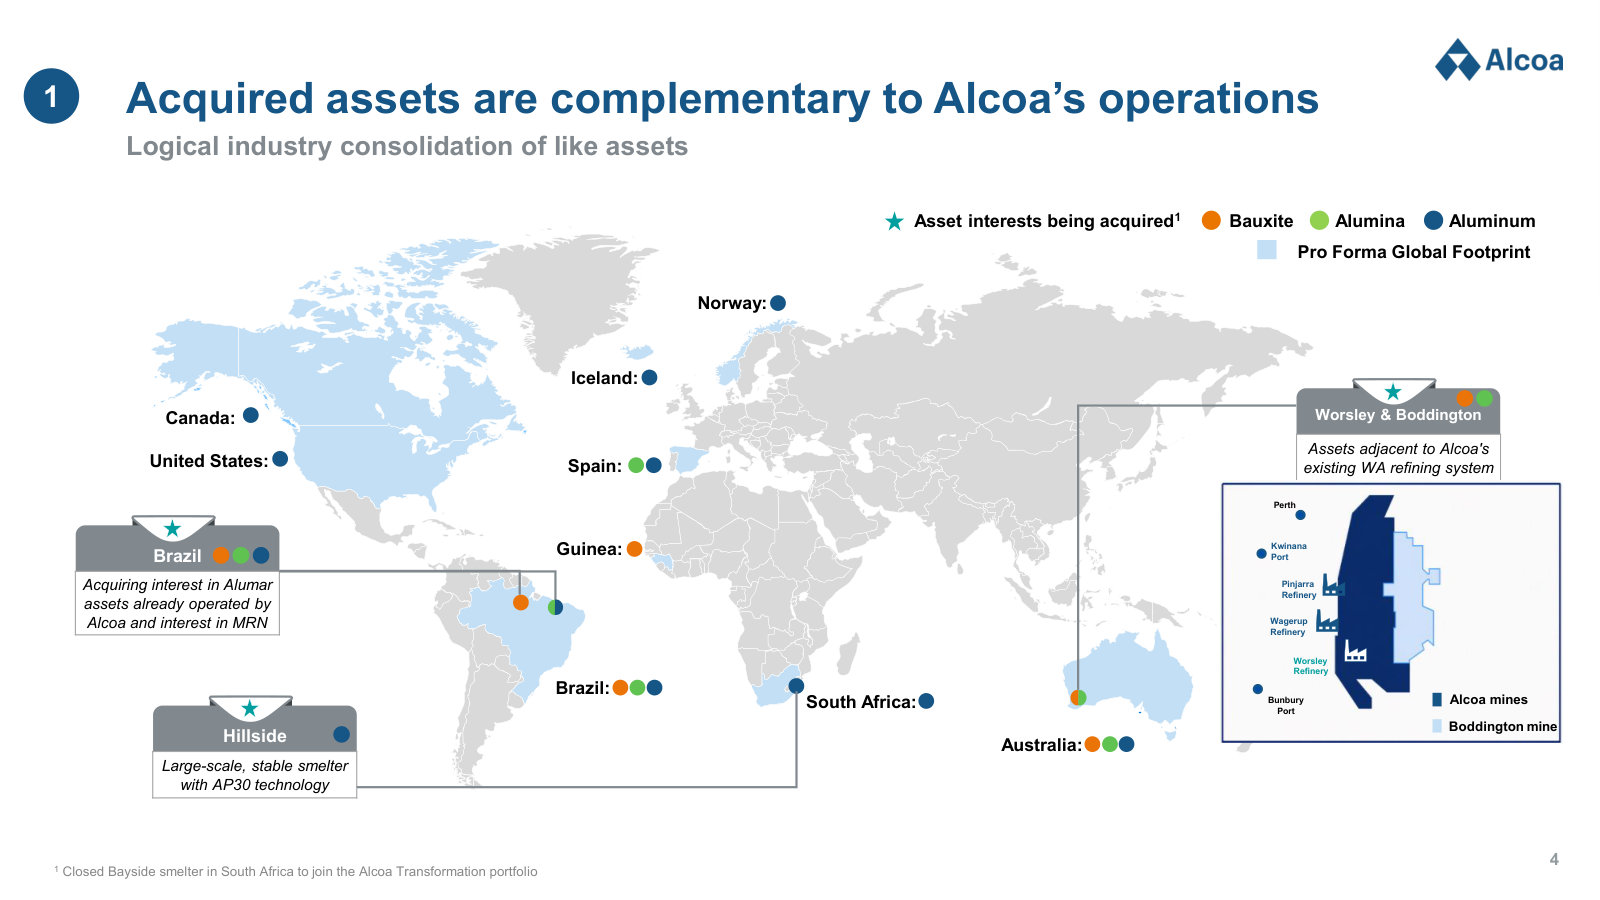
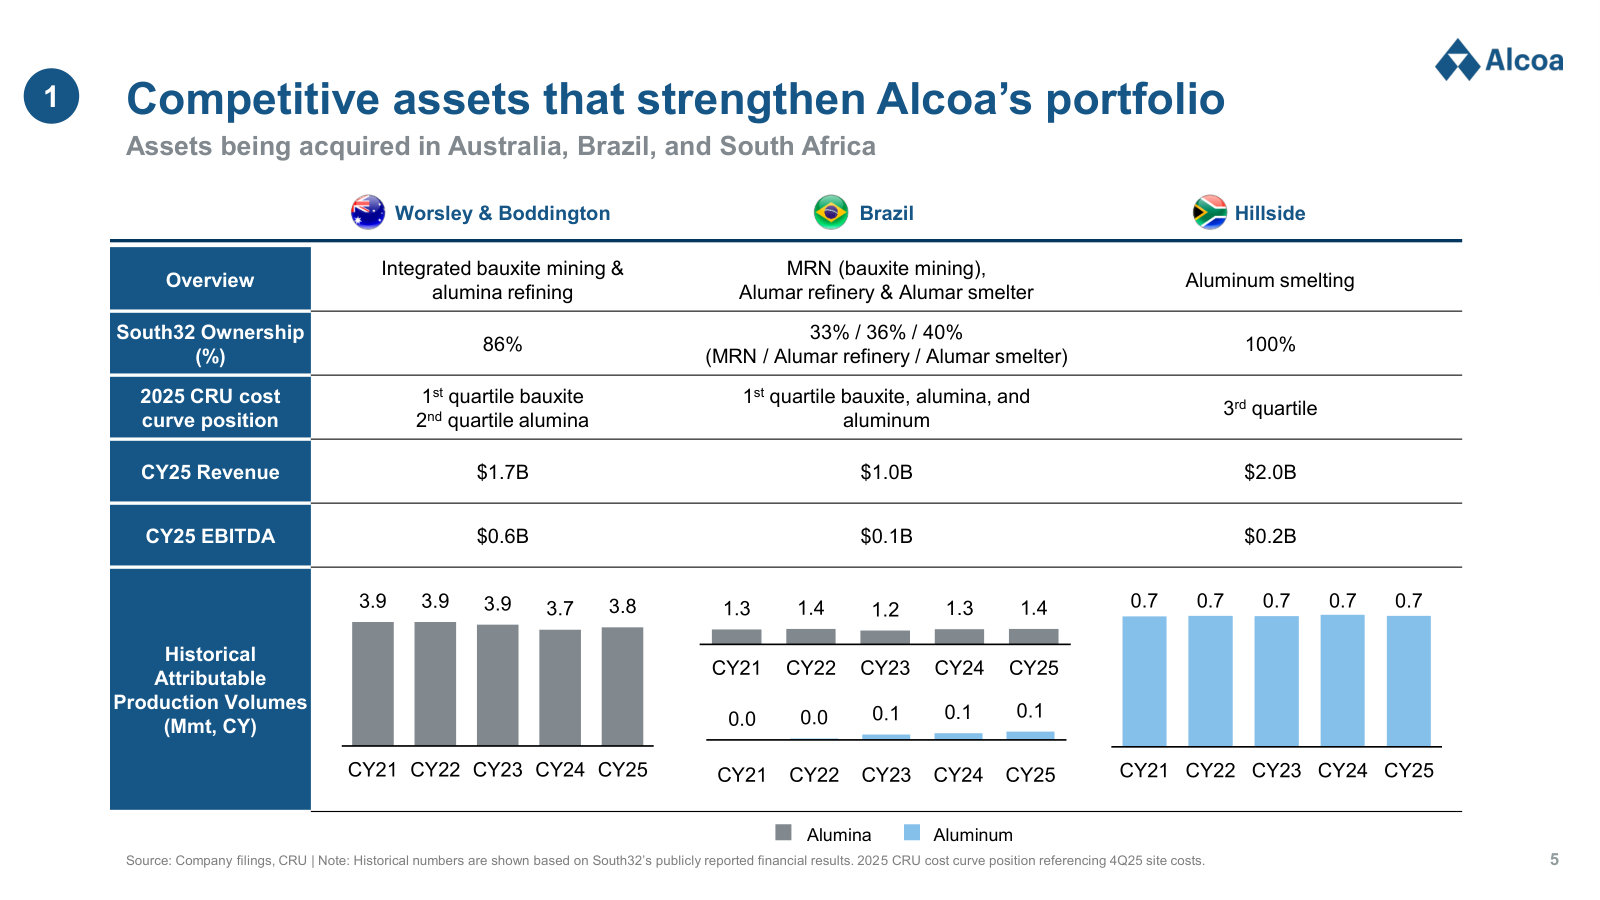
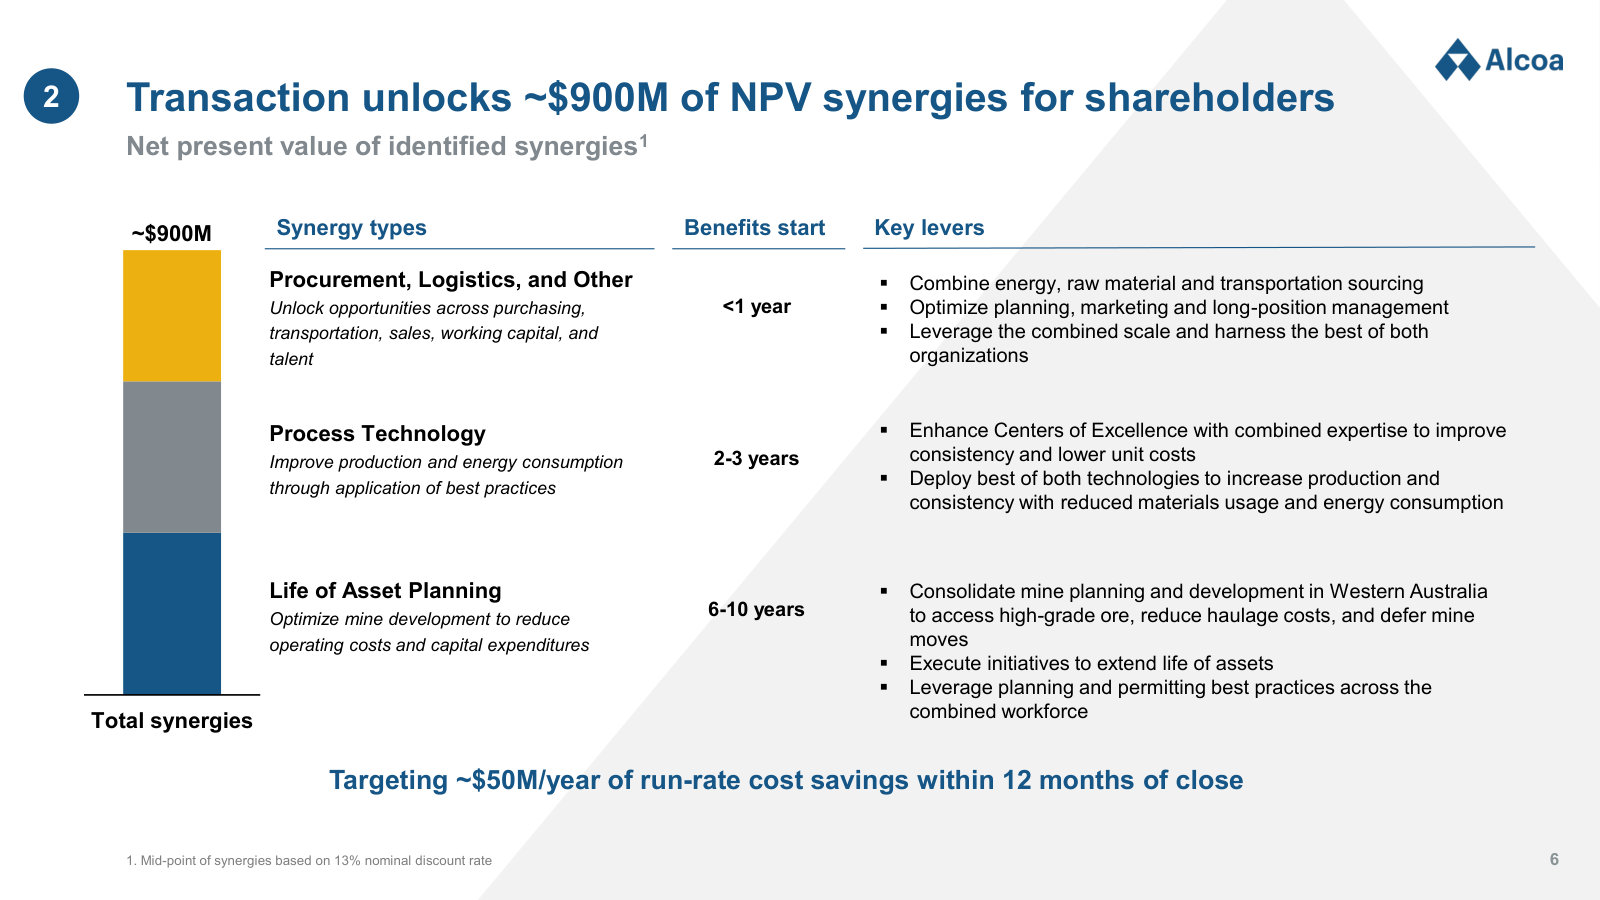
South32 Bauxite, Alumina & Aluminum Acquisition — 2026
The deep-dive on Alcoa's largest recent strategic move — buying South32's bauxite, alumina and aluminum assets, and the case for it. · Open the full document →
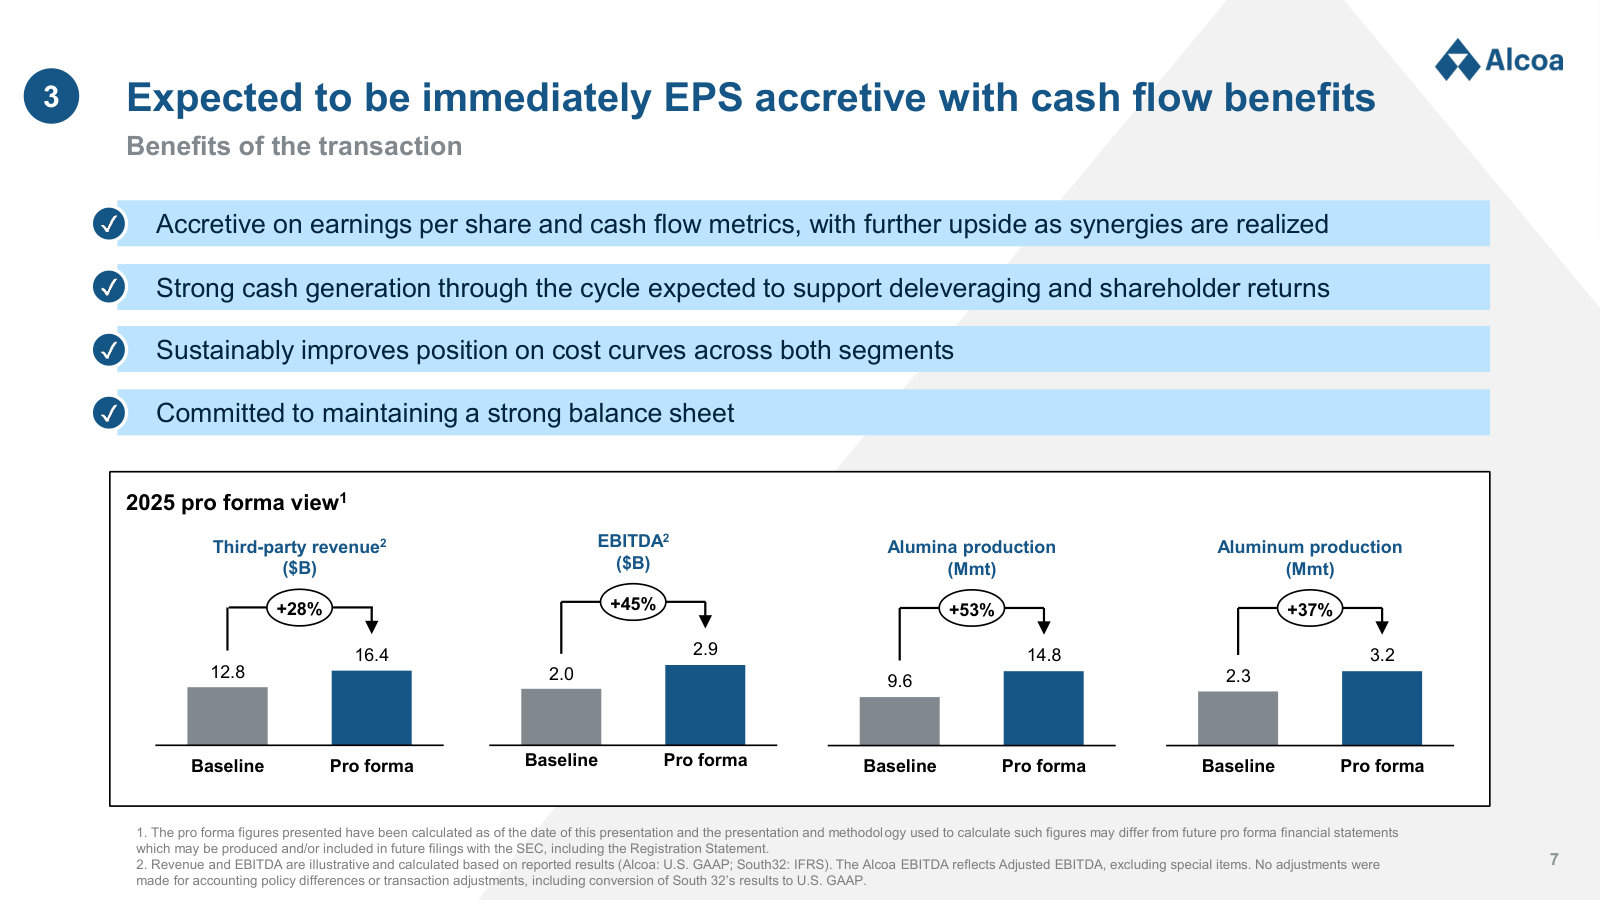
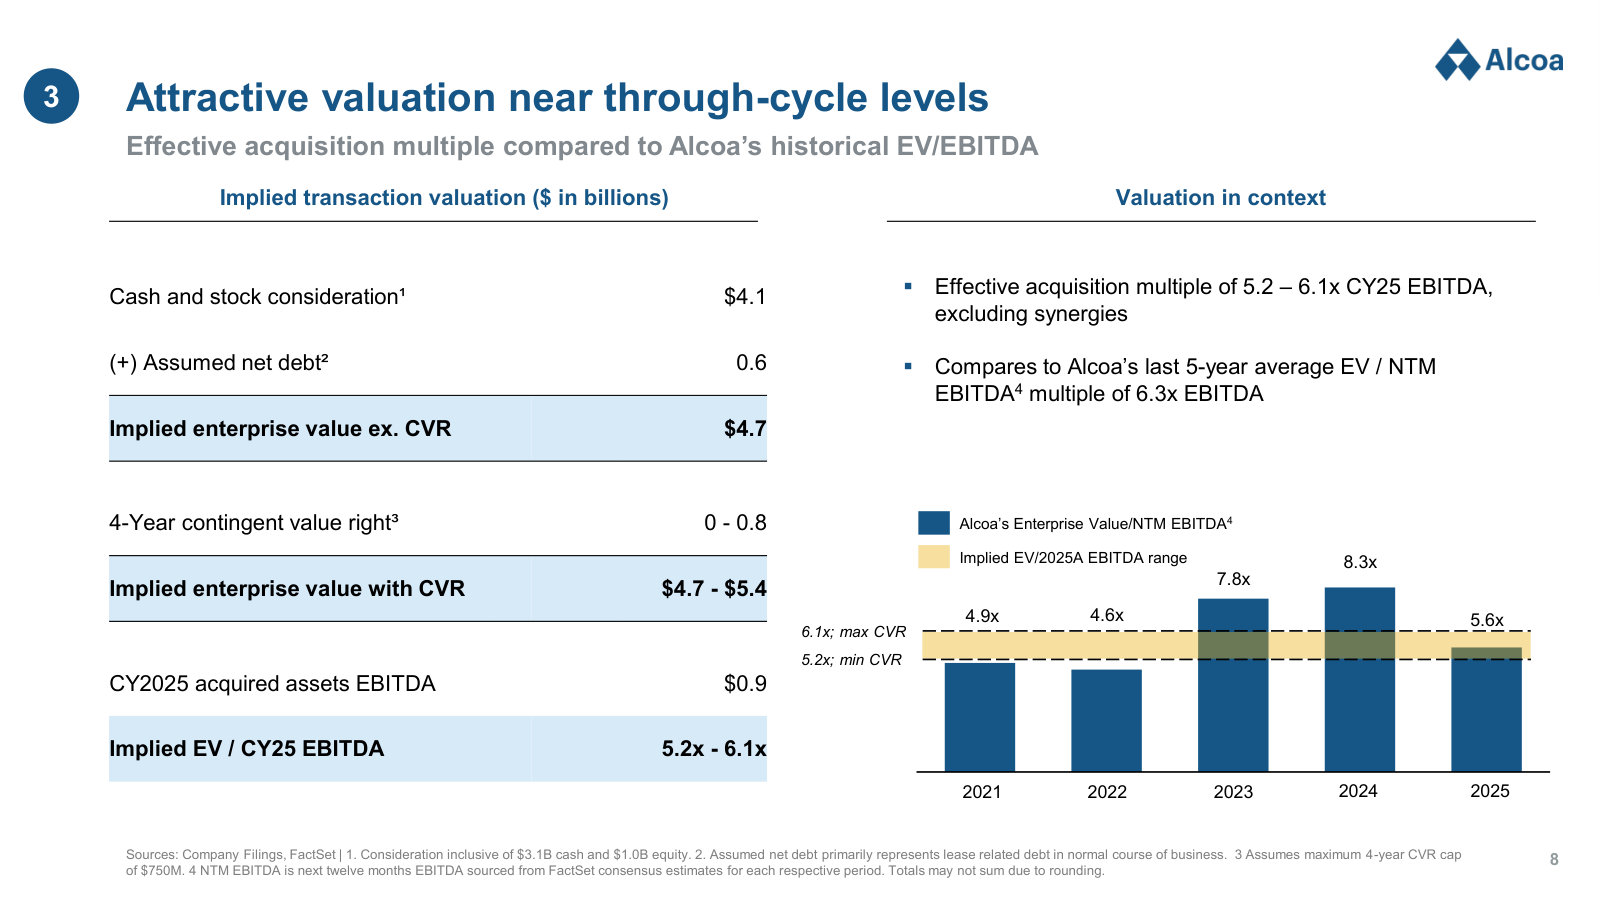
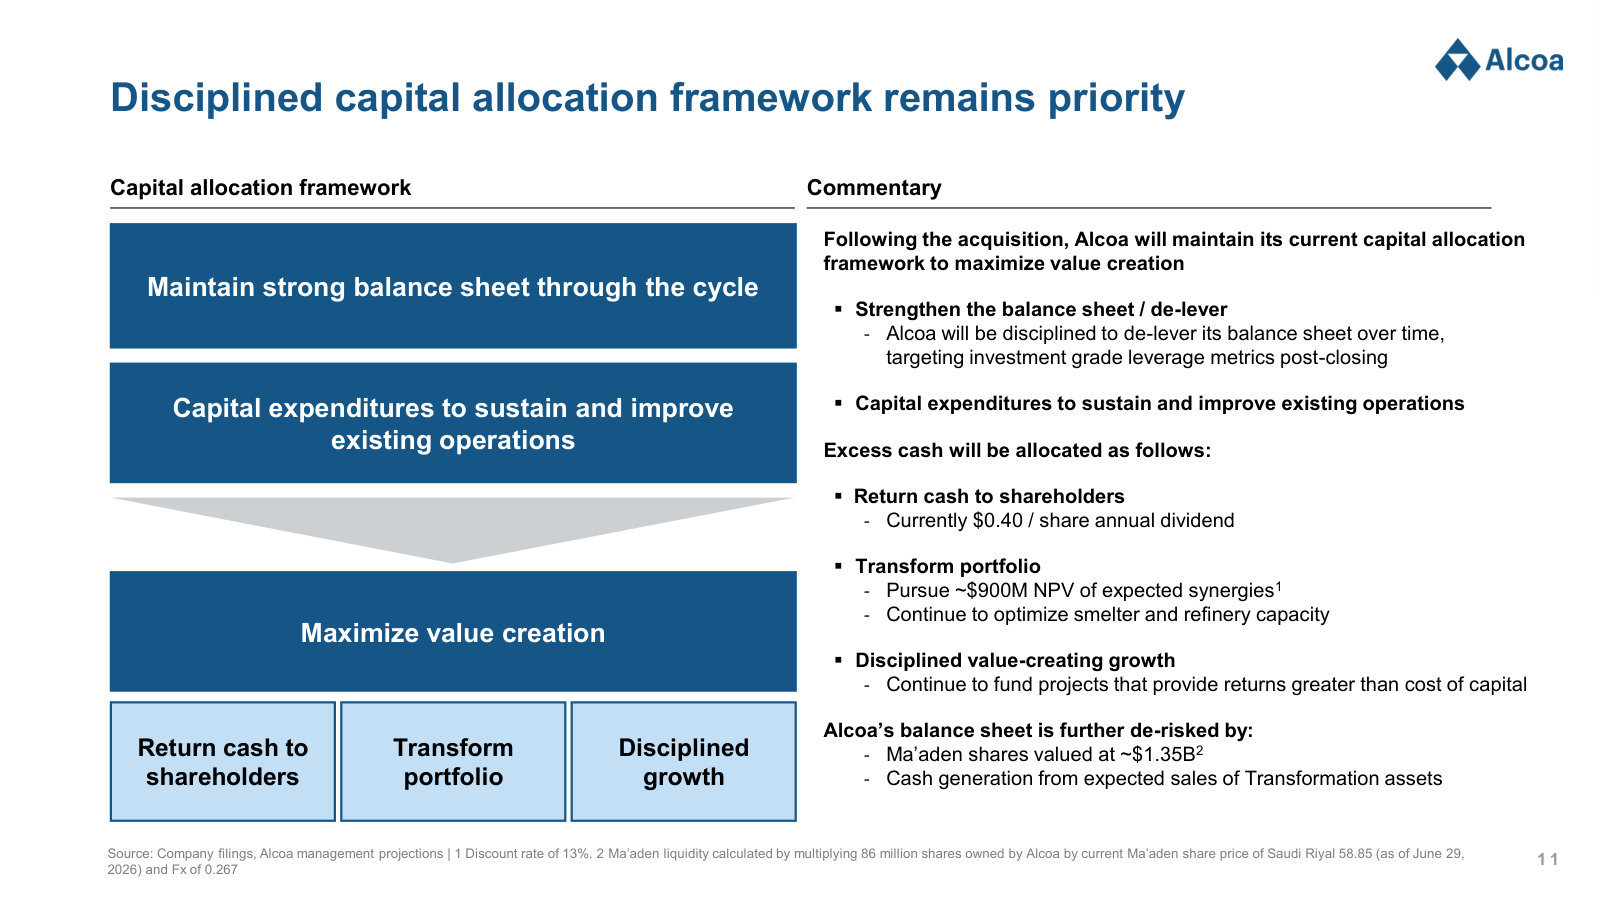
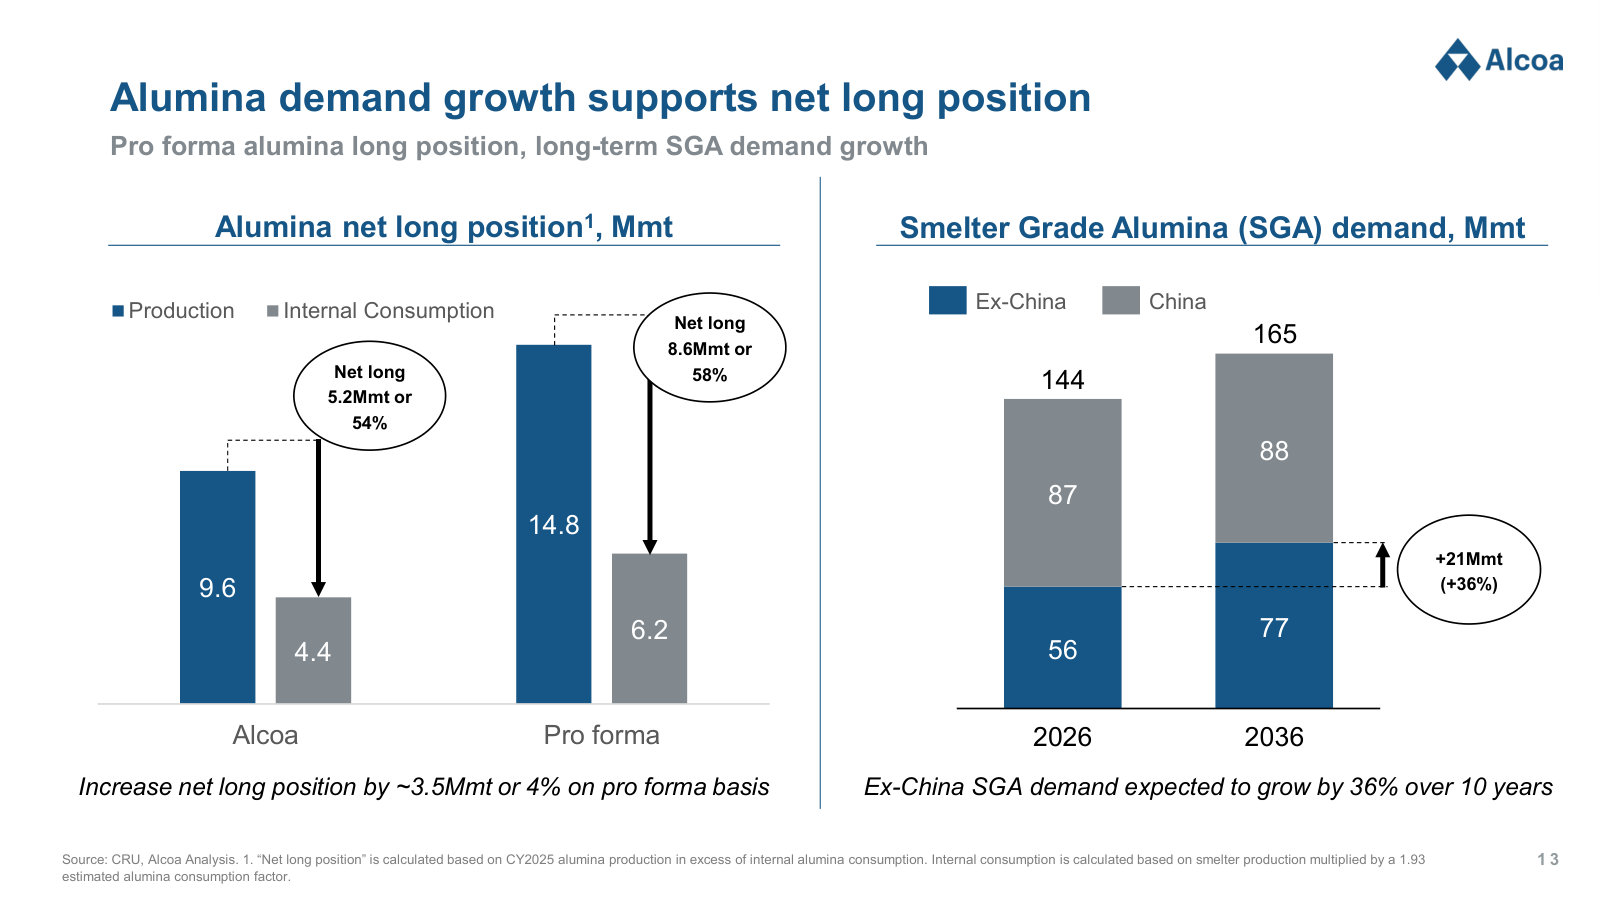
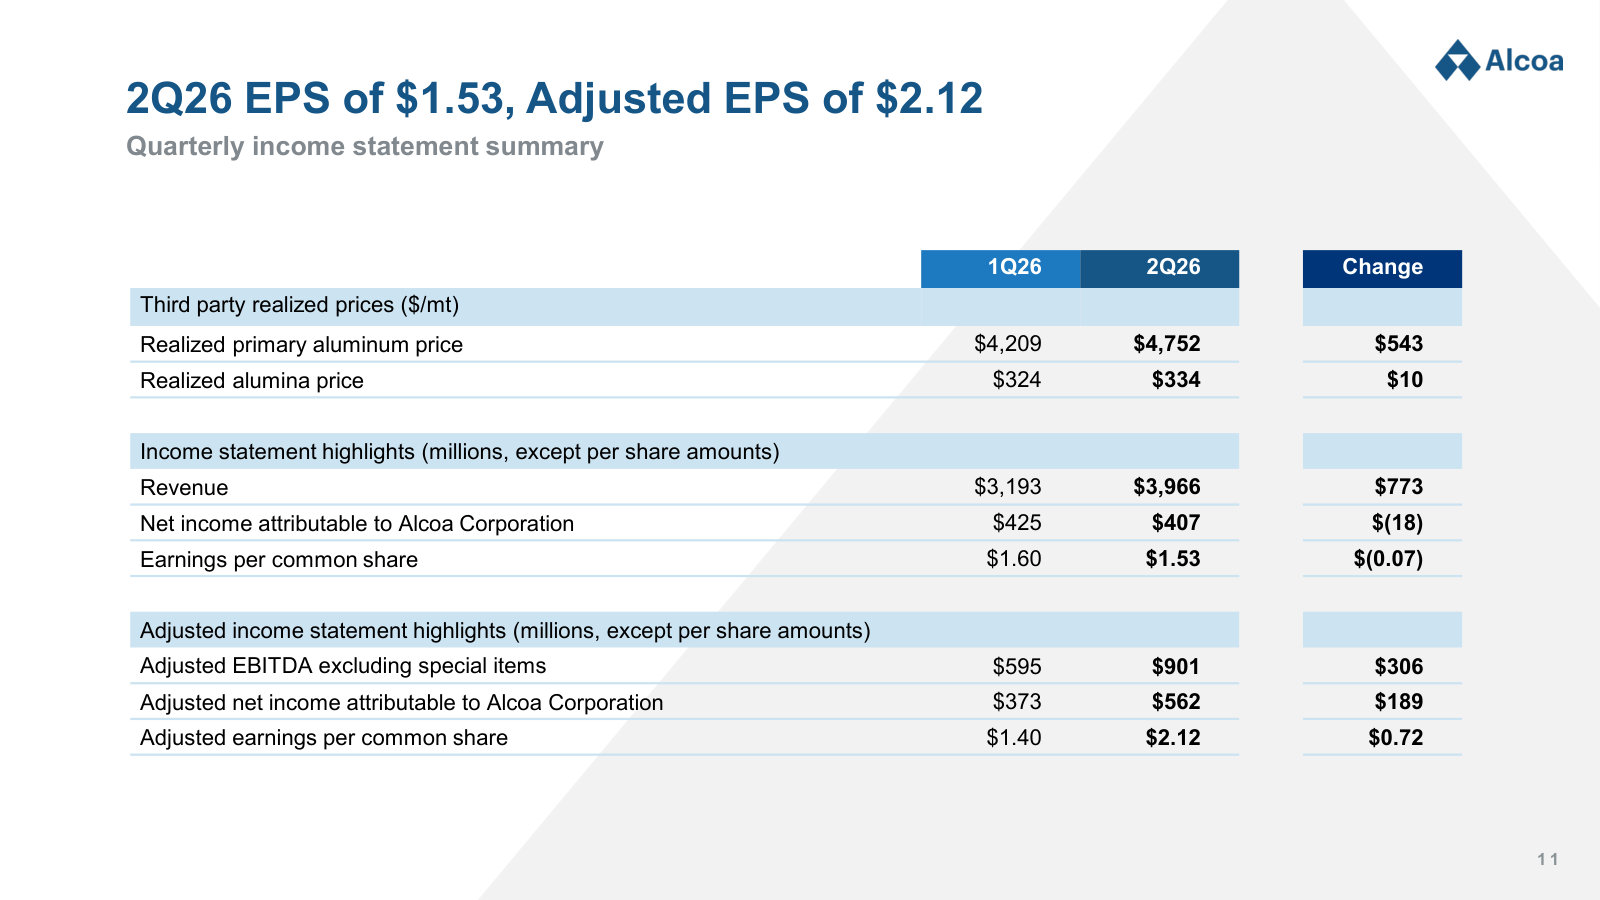
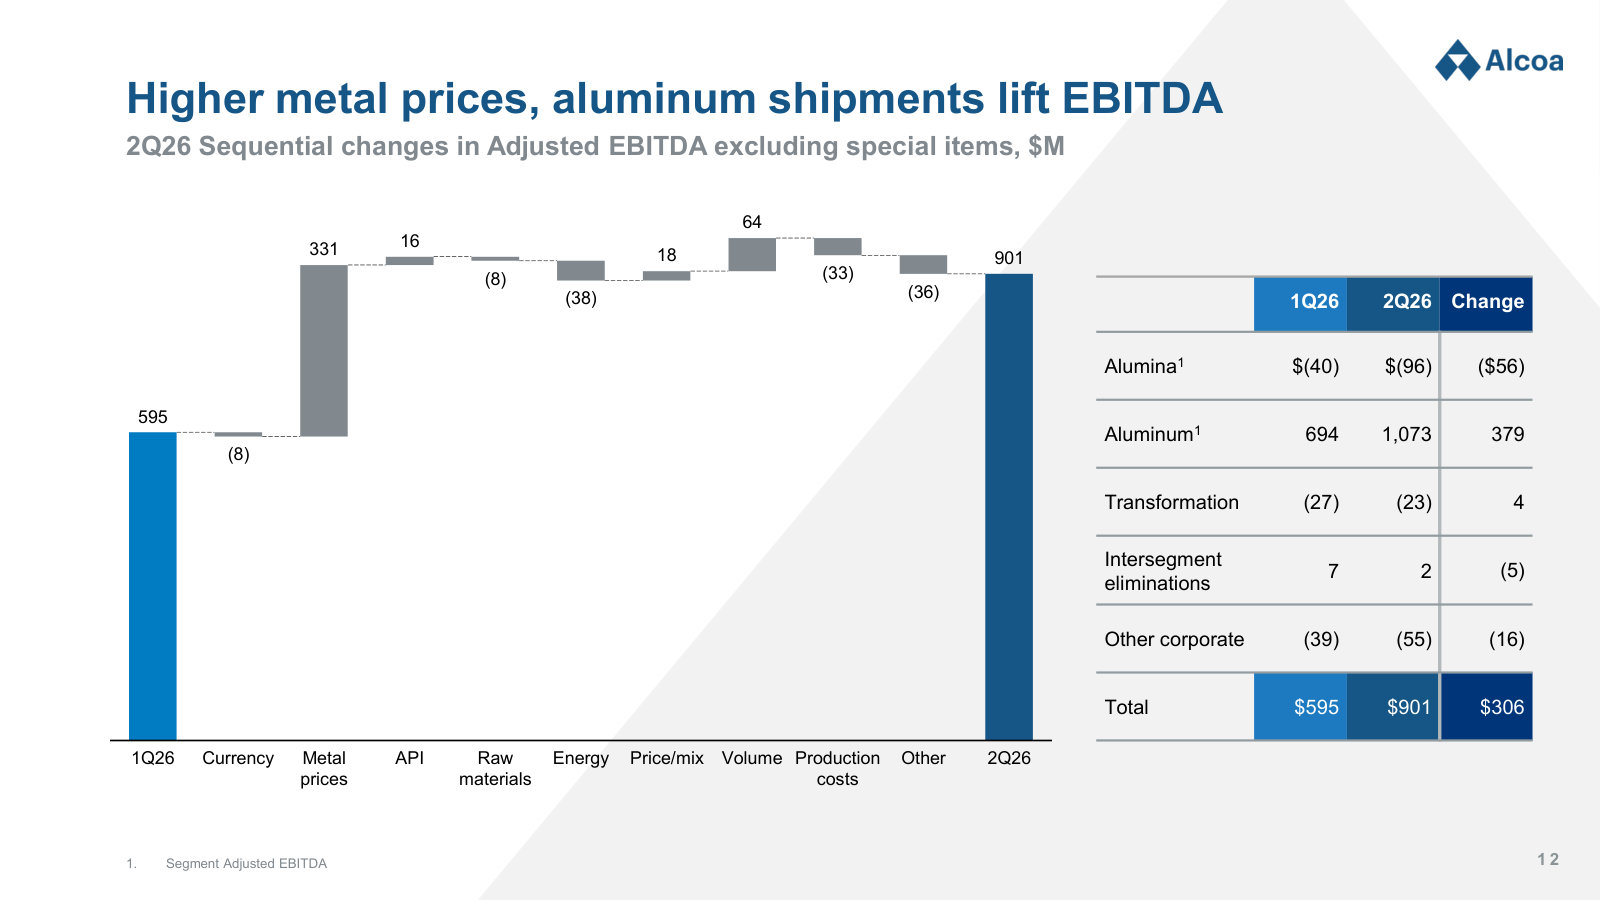
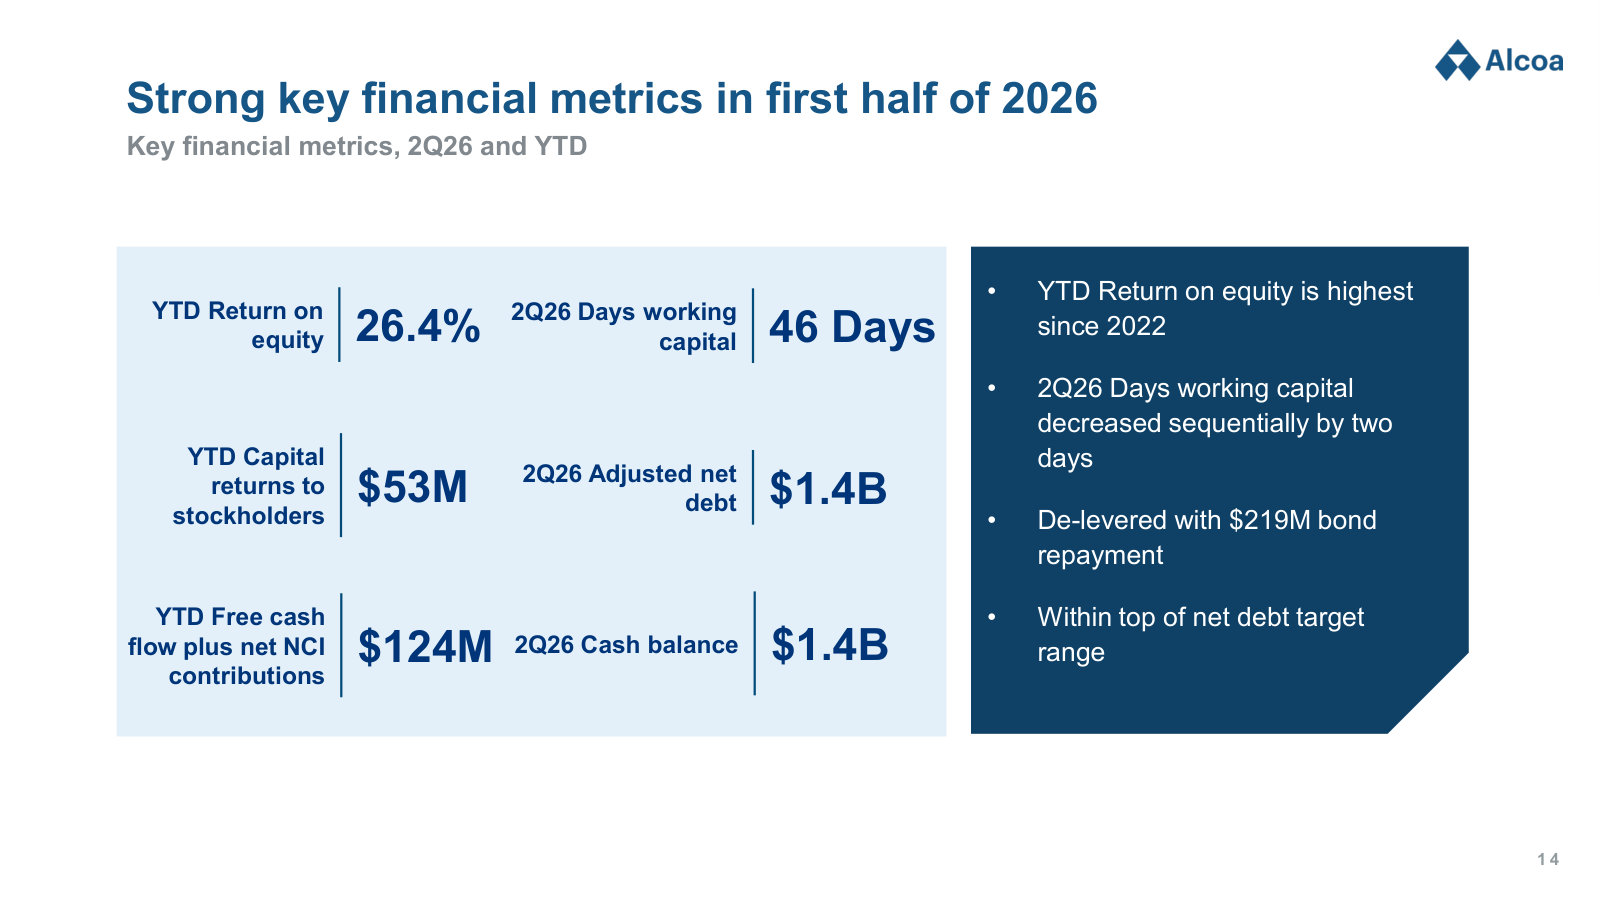
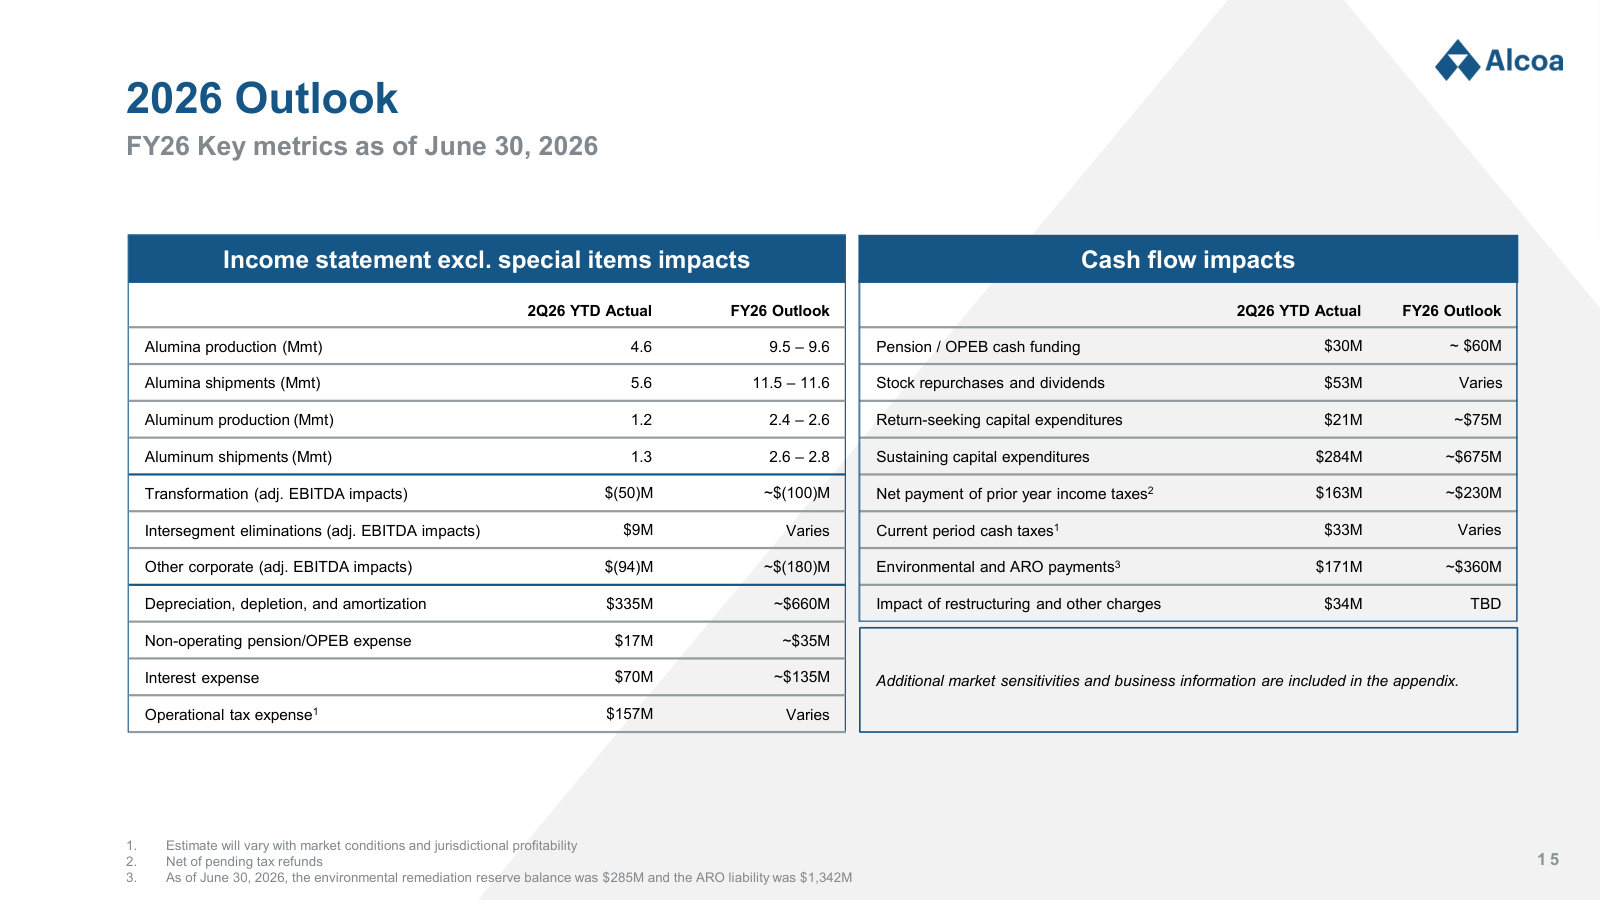
Second Quarter 2026 Earnings — 2Q 2026
The most recent results deck — current earnings, the balance sheet, guidance and the cleanest slides on cost structure and pricing. · Open the full document →
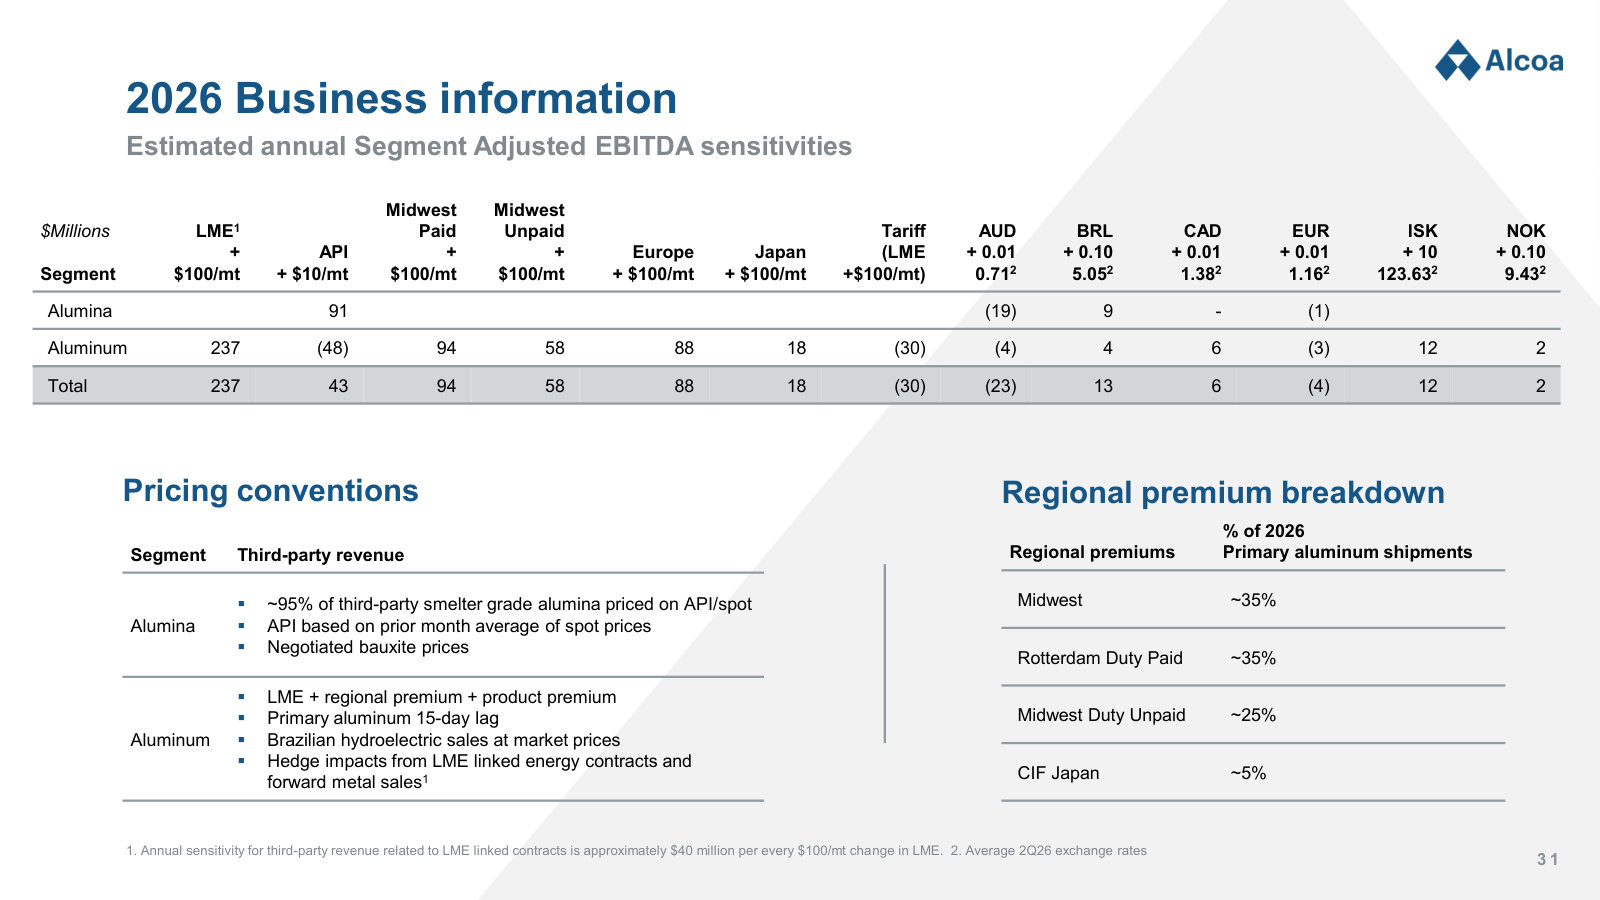
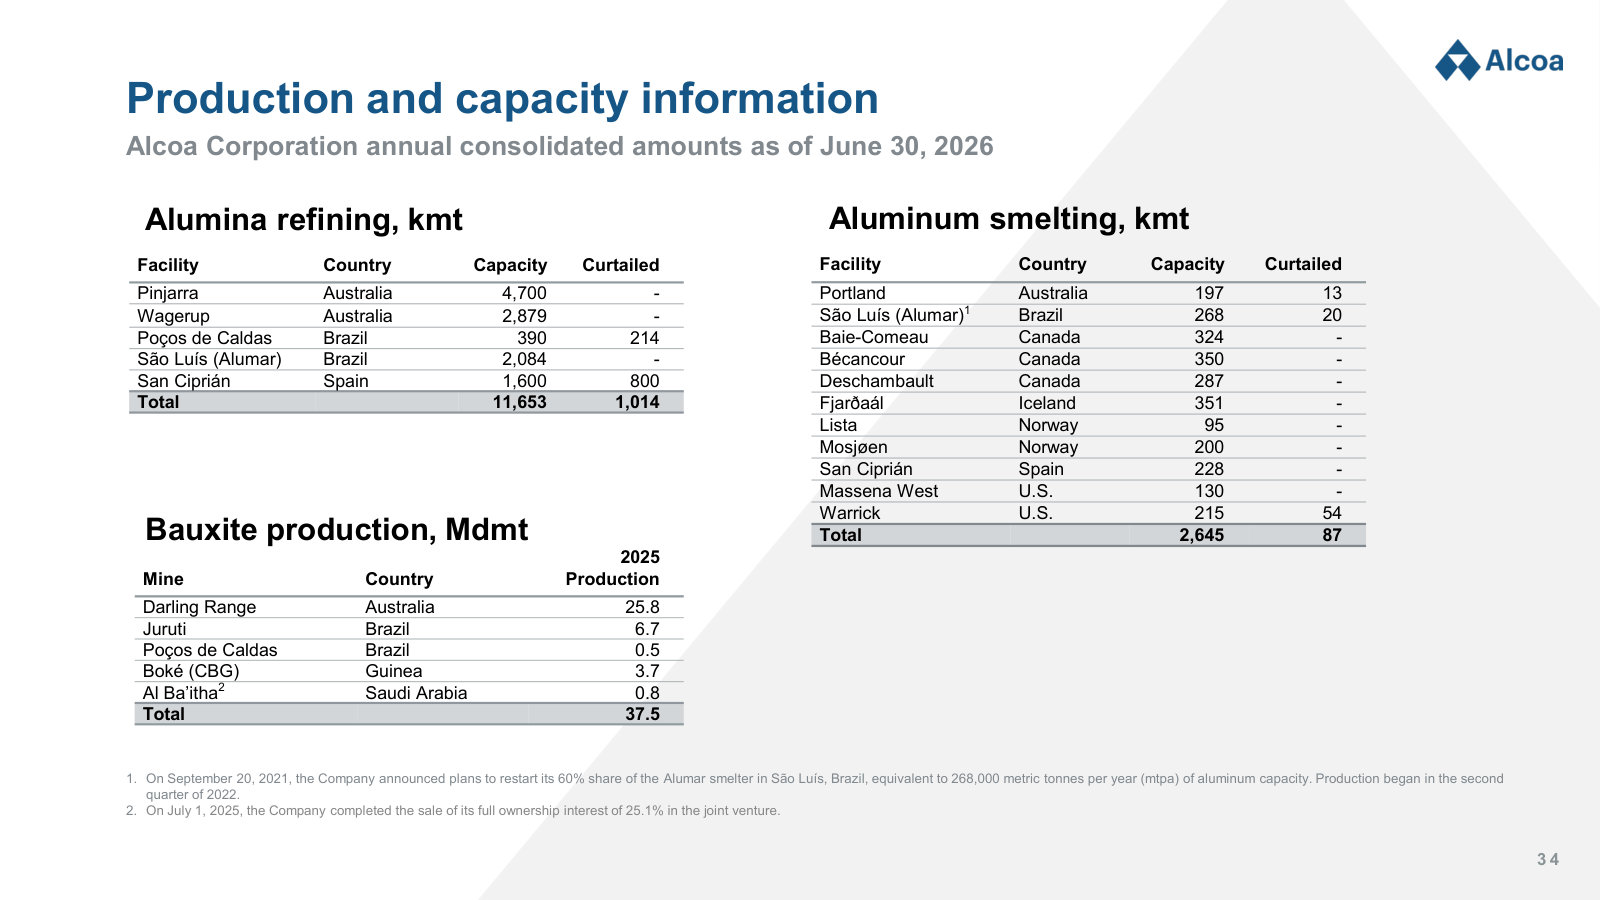
More from management
Investor Presentation (Q4 2025) — FY 2025 · 39 pages · Alcoa's standing investor deck built around full-year 2025 results, with the value-chain and cost-structure primer slides. · Open →
Alumina Limited Acquisition (2024) — 2024 · 24 pages · The Feb 2024 deal to buy out Alumina Ltd and take 100% of the AWAC bauxite-and-alumina JV that underpins today's Australian core. · Open →
Alcoa Corporation's management answers for the business every quarter. These are the exchanges that explain it best — verbatim, from the call transcripts preserved in Sources. Each link opens the full transcript at that page in a new tab.
Q2 FY2026 Earnings Call — Q2 FY2026 (calendar Q2 2026)
The clearest single explanation of the South32/Alumina Limited Group acquisition and the industry thesis behind Alcoa's buy-not-build strategy. · Open the full transcript →
The post-Iran price retreat was sentiment, not fundamentals; China's 45Mt-plus run is creeping utilization, not a policy shift.
Timna Tanners (Analyst, Wells Fargo); William F. Oplinger (President and Chief Executive Officer): I wanted to take a step back and ask a little bit about, I know you referred to the aluminum price retreat, of course, of late and attributed it to macro factors. But your last slide deck talked extensively about the disruptions in the Middle East, and you alluded to them again this time, but yet the aluminum price, as you point out, has gone to pre-Iran conflict levels. So what do you attribute that to? And along those same lines, some people are worried about China contributing to that retreat and overproducing. What do you think is happening in China? […] So I will address both of those, Timna. The first answer is sentiment. The fundamentals from when the Iran conflict started have not fundamentally changed. So we believe at this point there is between three and 3.5 million metric tons of capacity offline within the Strait of Hormuz, and that caused prices to run up. Subsequently, when conflict resolution signals emerged, that caused prices to run down. Fundamentals have not really changed at this point. That capacity is still offline and as the Strait stays closed for longer, it becomes more difficult for the existing capacity in the region to continue to operate. So we believe it is sentiment driven. Within China, we are now projecting that China will run around 45 million metric tons of production during the course of the year. Yes, that is higher than the 45 million metric ton cap. We do not believe that is a signal of a change in philosophy within China. They have not opened up new capacity. This is just creeping utilization of the assets that they have given the higher metal price.
p. 8 · Read in context →
Western Australia mine approvals: confidence in the outcome, but timing may slip — with six-month contingency built in.
Glyn Lawcock (Analyst, Barrenjoey); William F. Oplinger (President and Chief Executive Officer): Regarding the approvals, our approvals are continuing on the current path and are progressing well. When I was in Australia, I met with many of the key stakeholders of the process directly. My meetings reaffirmed my confidence in ultimately securing the mining approvals. That said, they also highlighted the number of important steps remaining in the process. As a result, while my confidence in the outcome remains unchanged, the timing could extend beyond our original expectations. You recall that we had said we would have our ministerial approval by the end of the year. If the approvals are delayed beyond that, we have contingency plans in place for various scenarios that would support the operations. We have built in contingency for a six-month delay where there will be no impact on supply and no expected impact on quality or cost. And if it goes beyond that, we have secondary contingency plans where we would consider modifying mining operations and flow rate at the refineries to avoid an ore gap. So nothing has fundamentally changed regarding our confidence, and through our recent engagement with the stakeholders in Australia, we did gain additional insight into the work that remains to be completed before approvals can be finalized. Importantly, this is a matter of timing rather than outcome, and I am confident in ultimately securing the necessary approvals.
p. 9 · Read in context →
Q4 & Full-Year 2025 Earnings Call — Q4 FY2025 / Full Year 2025
The full-year strategy call: cost-curve positioning, how tariffs turned into a customer pass-through, and the restart-vs-build growth logic. · Open the full transcript →
The alumina franchise in one breath: low on the cost curve, and the supplier of choice at premiums above index.
William Oplinger (President and Chief Executive Officer): Despite near-term market pressures, we remain confident in the long-term fundamentals of the alumina industry. Alcoa is exceptionally well-positioned to navigate market volatility thanks to our low-cost mining and refining portfolio and our strong operational performance. And beyond our cost advantage, Alcoa's ability to provide value to customers through quality product and reliability enables us to secure long-term supply contracts with premiums above index pricing, highlighting Alcoa's position as the alumina supplier of choice for long-term partnerships.
p. 3 · Read in context →
Why tariffs help more than hurt: the Midwest premium fully offset the Canada tariff, and Alcoa owns two of four U.S. smelters.
William Oplinger (President and Chief Executive Officer): In aluminum, Alcoa is uniquely positioned to benefit from globally constrained supply and selling into high-premium regions. In the fourth quarter, regional premiums strengthened across the board, supported by robust fundamentals, U.S. tariffs, supply disruptions, and anticipation of Europe's carbon border adjustment mechanisms scheme, or CBAM. In North America, the Midwest premium rose sharply, providing a significant benefit to Alcoa given our U.S. production. Importantly, the higher Midwest premium fully offset tariff costs on shipments from Canada to the U.S. And I'll remind everyone of the four smelters still operating in the U.S. Alcoa owns two, giving us an advantage as the Midwest premium continues to increase.
p. 3 · Read in context →
Over $1B of gross annual tariff cost — now fully passed to customers because the Midwest premium rose to cover it.
Glyn Lawcock (Analyst, Barrenjoey); William Oplinger (President and Chief Executive Officer): The Midwest premium obviously has risen to cover the total tariff expense. As a company, we're probably spending over $1 billion in gross tariff expense on an annual basis, but the Midwest premium is high enough to cover that. So the tariffs in their entirety are getting passed on to customers at this point.
p. 8 · Read in context →
Restart vs. buy vs. build: no greenfield smelters pencil at today's energy prices; growth, if any, comes from brownfield.
Lachlan Shaw (Analyst, UBS); William Oplinger (President and Chief Executive Officer): It really depends on what product line that you're looking at. So remember that we have three different product lines, bauxite, alumina, and aluminum. At this point, we do not have greenfield expansion plans for aluminum, and we've not found anywhere around the world that provides a sufficiently low energy price for sufficient returns on a greenfield plant at this point. In the case of refining and bauxite, very similar. Refining capital costs are still fairly high. And certainly at today's prices, it makes it difficult for a greenfield expansion. Now with that said, we do have brownfield opportunities to potentially grow in both mining, refining, and smelting. But at this point, we don't have significant greenfield plans going forward.
p. 10 · Read in context →
Q1 FY2025 Earnings Call — Q1 FY2025
The tariff-shock call — management lays out the structural U.S. aluminum deficit and its capital discipline just as Section 232 hit. · Open the full transcript →
The company in one sentence: a pure-play, mine-to-metal aluminum producer built to maneuver through policy and price shocks.
William Oplinger (President and CEO): As a pure-play aluminum company, vertically integrated from mine to metal with a global footprint and cost-effective portfolio of assets, Alcoa has the ability to maneuver and respond to challenging and changing markets and policies. Security of supply through long-term contracts is valued by our customers.
p. 4 · Read in context →
Capital discipline under a shock: Alcoa won't restart idled capacity on a tariff that can change overnight.
Timna Tanners (Analyst, Wolfe Research); William Oplinger (President and CEO): any updated thoughts on the stickiness of these tariffs? And if sticky, do you think about restarting Warwick in what timeframe? […] Timna, thanks for the question. Hard to make a restart decision based on a tariff that can change and I really can't comment on the stickiness because we've seen the volatility of discussions around the tariffs over the last 60 days. So, yeah, we just don't know whether they will stick. And we wouldn't necessarily make a decision to restart capacity simply based on tariffs, just because they can change.
p. 5 · Read in context →
The capital-allocation frame: investment-grade metrics through the whole cycle, and an adjusted net-debt target of $1–1.5B.
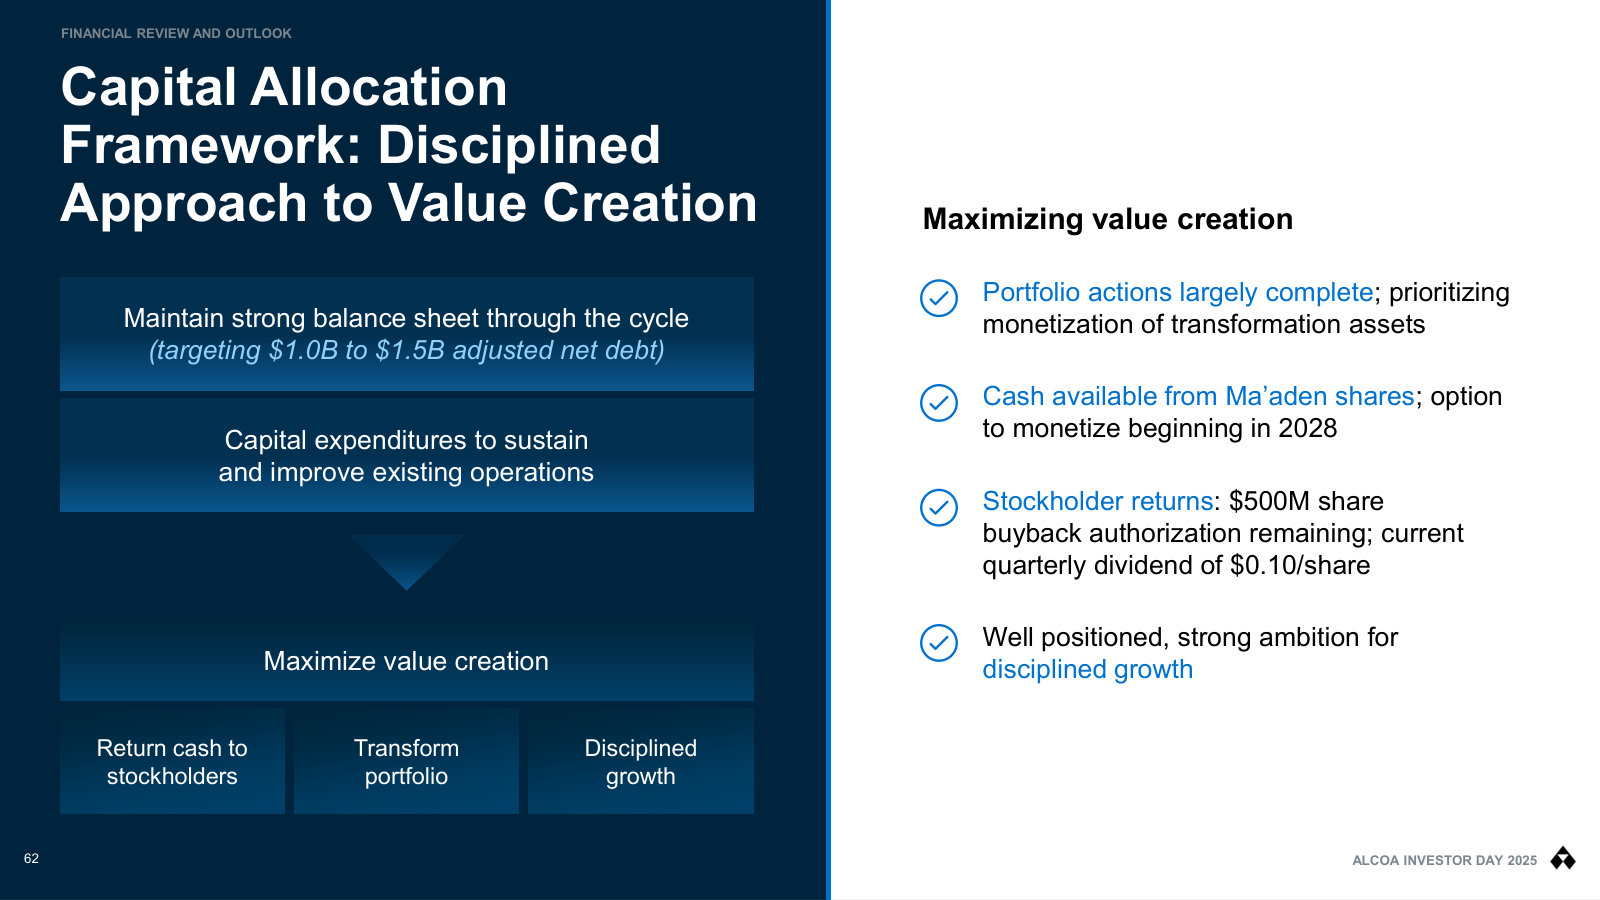
Molly Beerman (CFO): Our overall capital allocation framework remains unchanged. It starts with maintaining a strong balance sheet throughout the cycle, and sufficiently funding our operations to sustain and improve them. The optimal capital structure for our company is reached when investment-grade leverage metrics are achieved reducing our WACC and creating value for our stockholders through a higher company valuation, lower cost of financing, and improved project viability. We want to maintain investment-grade leverage metrics throughout all business cycles not only at the mid or top part of the cycle. […] Based on this, we first defined a target for adjusted debt which includes pension and OPEB liabilities. This target is $2.1 billion to $2.5 billion. Then considering our historical use rate of cash, we target a cash balance between $1 million and $1.5 million. Netting the cash with the adjusted debt, results in our targeted range of adjusted net debt of $1 billion to $1.5 billion.
p. 2 · Read in context →
Q1 FY2024 Earnings Call — Q1 FY2024
Where the Alumina Limited (AWAC) buyout and Alcoa's vertical-integration and long-term demand thesis are first laid out. · Open the full transcript →
Buying out AWAC: taking 100% of the tier-1 bauxite and alumina assets Alcoa already operates, and simplifying a complex JV.
William Oplinger (CEO): Our proposed acquisition of Alumina Limited, which would give Alcoa 100% ownership in the Alcoa World Alumina and Chemicals, or AWAC, joint venture. […] Today, through a complex web of holdings at a subsegment level, Alumina Limited shareholders have exposure to 40% of only the AWAC bauxite, alumina and aluminum assets. […] For Alcoa stockholders, the transaction increases Alcoa's economic interest in our core tier-1 bauxite and alumina assets and simplifies governance, resulting in greater operational flexibility and strategic optionality. It advances our position as the global pure play upstream aluminum company and enhances Alcoa's vertical integration along the value chain across bauxite mining, aluminum refining, and aluminum smelting. Alcoa would significantly increase its ownership in five of the 20 largest bauxite mines and five of the 20 largest alumina refineries globally, excluding China.
p. 1 · Read in context →
The long demand case: aluminum as a copper substitute and electrification metal, with demand seen up ~80% by 2050.
Lucas Pipes (Analyst, B. Riley Securities); William Oplinger (CEO): I firmly believe that aluminum plays a crucial role in the global energy transition expected over the next 25 years. While copper is extremely important, aluminum is equally significant. Historically, there has been a ratio of about 3.5 times between copper and aluminum prices, meaning that as copper prices rise, we see a substitution effect where aluminum is used more. This trend is evident today, and as copper continues to increase in price, it should benefit aluminum. Moreover, aluminum is essential for electrification and electric vehicles, as well as in solar panel applications and wind turbines. We anticipate an 80% increase in aluminum demand between now and 2050, indicating a positive outlook for both aluminum and copper, especially aluminum.
p. 13 · Read in context →
The San Ciprián line in the sand: run a broad sale process, but no more Alcoa cash if viability can't be assured.
Timna Tanners (Analyst, Wolfe Research); William Oplinger (CEO): I want to gain a clearer understanding of Spain. You're discussing the potential sale of assets, yet at the same time, expressing a lack of optimism about them. Would a prospective buyer need substantial financial resources and perhaps a different relationship with the union and government? How does one sell an asset if it's perceived to be struggling? […] running a really broad-based sale process and we've gone out to just about every strategic and financial buyer in the industry. And it will really be up to them to take a position around how they view some of the things that they can achieve either with the union or through governmental support and metal prices and alumina prices, right? So, if somebody has a view that Europe will be short metal for the long term, potentially they can justify buying the assets. We'll go through that process, at the same time as I said, we'll be very focused around trying to ensure the viability of the site for ourselves and for a potential future buyer. And if we get to the second half of this year and we don't have a buyer and we can't assure the viability, as we've said, we're not putting more money into that site and hard decisions will have to be made at that time.
p. 9 · Read in context →
Q2 FY2022 Earnings Call — Q2 FY2022
A cycle-peak snapshot under CEO Roy Harvey: how the integrated model behaves at the top — record cash, buybacks, and cost-curve advantage. · Open the full transcript →
Peak-cycle capital returns: $387M returned year-to-date, buybacks stepped up, and a fresh $500M repurchase authorization.
Roy Harvey (President and Chief Executive Officer): Strong cash flow in the quarter supported capital returns to our stockholders. Year-to-date we have provided $387 million in capital returns. This includes $275 million in stock buybacks during the second quarter and $19 million in cash dividends, which the company paid on June 3rd at the rate of $0.10 per share. Also today we announced an additional authorization of $500 million for future stock repurchases supplementing the $150 million that remains from the prior authorization.
p. 3 · Read in context →
How the model wins in stress: with 10–20% of world smelting underwater, Alcoa's deficit-market, integrated supply is advantaged.
Roy Harvey (President and Chief Executive Officer): Based on June’s average prices, we estimate that between 10% to 20% of worldwide smelting capacity was underwater last month. At some points in the first week of July, the SHFE spot price are likely to have pushed around half of Chinese smelting capacity underwater. In these conditions, however, suppliers like Alcoa that produce in markets with structural deficits like North America and Europe remain in an advantaged position as many consumers preferred domestic suppliers with integrated supply chains.
p. 7 · Read in context →
The capital-allocation framework, stated plainly: strong balance sheet first, then portfolio transformation, growth, and cash returns.
Emily Chieng (Analyst, Goldman Sachs); William Oplinger (Executive Vice President and Chief Financial Officer): we have a capital allocation program that’s focused on maintaining a strong balance sheet, sustaining the plants and sustaining the operations. And then you’ve heard us say there’s three prongs of that capital allocation after we’ve done that. And in no particular order transforming the portfolio, positioning for growth and returning cash to shareholders.
p. 16 · Read in context →
More calls
Q1 FY2026 Earnings Call — Q1 FY2026 · 12 pages · The first 2026 quarter and the market read just before the South32 deal was announced; continued deleveraging toward the net-debt target. · Open →
Q3 FY2025 Earnings Call — Q3 FY2025 · 13 pages · A mid-cycle update as aluminum prices climbed, with a long Timna Tanners exchange probing demand and the tariff arithmetic. · Open →
Q2 FY2025 Earnings Call — Q2 FY2025 · 11 pages · The first full quarter with Section 232 tariffs in the numbers — how the ~$100M net drag actually played out. · Open →
Q4 & Full-Year 2024 Earnings Call — Q4 FY2024 · 14 pages · The 2024 wrap and original 2025 guidance framework, set just before tariffs reshaped the year. · Open →
Q3 FY2024 Earnings Call — Q3 FY2024 · 14 pages · The first quarter as 100% owner of AWAC after the Alumina Limited deal closed on August 1, 2024. · Open →
Q2 FY2024 Earnings Call — Q2 FY2024 · 12 pages · The quarter the Alumina Limited acquisition moved to closing — integration mechanics and approvals detail. · Open →
Q4 & Full-Year 2023 Earnings Call — Q4 FY2023 · 30 pages · Oplinger's first full-year call as CEO: the Kwinana curtailment and the 2024 profitability/cost program are laid out. · Open →
Q1 FY2023 Earnings Call — Q1 FY2023 · 29 pages · A Roy Harvey-era baseline on alumina and aluminum margins as the post-2022 market normalized. · Open →
Alcoa Corporation's annual reports contain management's most considered account of the business. These are the sections, passages and visual pages worth opening in the originals preserved in Sources.
Alcoa Corporation — FY2025 Annual Report (Form 10-K) — FY2025
Latest 10-K: the fullest account of Alcoa's two-segment, vertically integrated model after a year of portfolio moves (Saudi JV sale, Kwinana closure, San Ciprián restart). · Open the full document →
Item 1. Business — p. 3 · Read the full section →
Defines the upstream model — bauxite mining, alumina refining, aluminum smelting — and the two reportable segments a reader must grasp first.
The vertically integrated model and its two reportable segments, Alumina and Aluminum.
Alcoa Corporation, a Delaware corporation (Alcoa or the Company) which became an independent, publicly traded company on November 1, 2016, is active in all aspects of the upstream aluminum industry with bauxite mining, alumina refining, and aluminum smelting and casting. The Company has direct and indirect ownership of 25 operating locations across eight countries on five continents. […] The Company’s operations are comprised of two reportable business segments: Alumina and Aluminum.
p. 3 · Read in context →
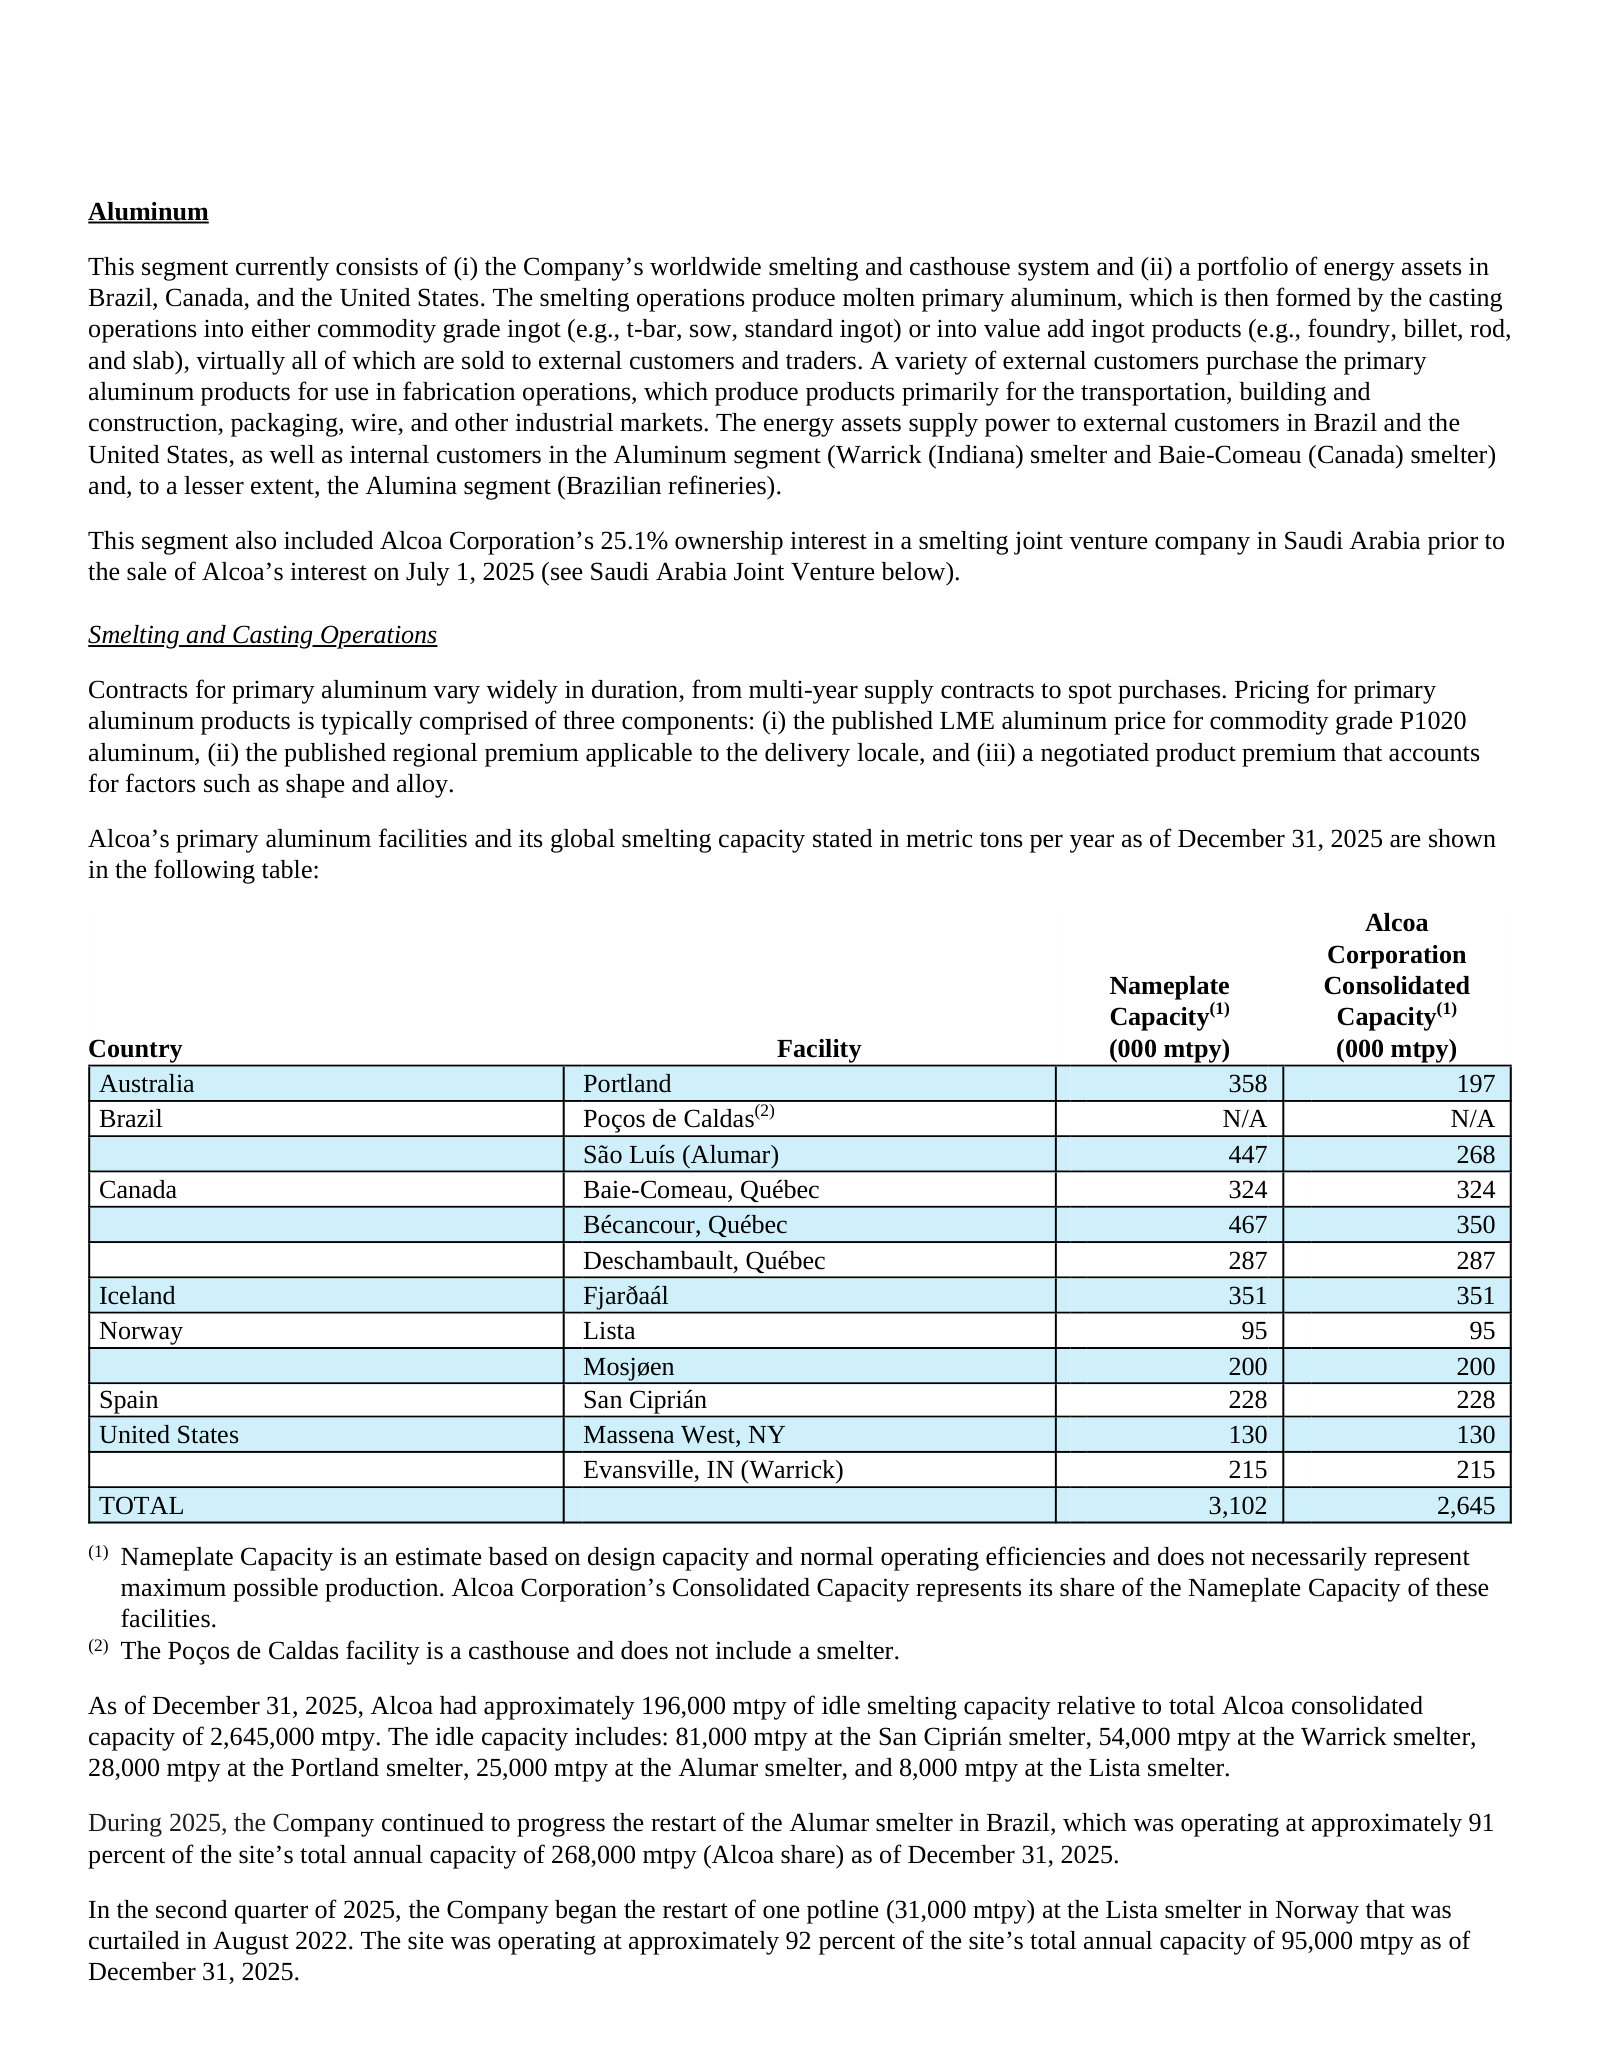
Item 1A. Risk Factors — p. 26 · Read the full section →
The company-specific risks that could genuinely bite: mining-permit renewals (central to the Australia grade story) and tailings/residue impoundment failure.
Mining depends on renewing permits — delays can lower bauxite quality and raise costs (the live Western Australia issue).
Our mining operations are subject to extensive permitting and approval requirements. […] Failure to obtain, maintain, or renew permits or approvals, or permitting or approval delays, restrictions, or conditions has in the past and may in the future impact the quality of the bauxite we are able to mine and could increase our costs and affect our ability to efficiently and economically conduct our operations, potentially having a materially adverse impact on our results of operations and profitability.
p. 30 · Read in context →
Tailings and bauxite-residue impoundments risk catastrophic failure — a physical hazard unique to Alcoa's asset base.
Some of our operations generate waste and other byproducts, which we contain in tailing facilities, residue storage areas, and other structural impoundments that are subject to extensive regulation and increasingly strict industry standards. Failure of storage areas caused by extreme weather events, erosion, or unanticipated structural failure of impoundments could result in severe, and in some cases catastrophic, damage to the environment, natural resources, or property, or personal injury and loss of life.
p. 42 · Read in context →
Item 2. Properties — p. 55 · Read the full section →
Regulation S-K subpart 1300 mining disclosure — the bauxite reserve base and grades that underpin the whole business, rare in an industrial 10-K.
Mining rights at Darling Range and Juruti extend more than 15 years — the resource runway behind the refineries.
Alcoa has access to large bauxite deposit areas with mining rights that extend, in the cases of Darling Range and Juruti, more than 15 years from the date of this Form 10-K. The Company obtains bauxite from its own resources located in the countries listed in the table below, as well as pursuant to both long-term and short-term contracts and mining leases.
p. 55 · Read in context →
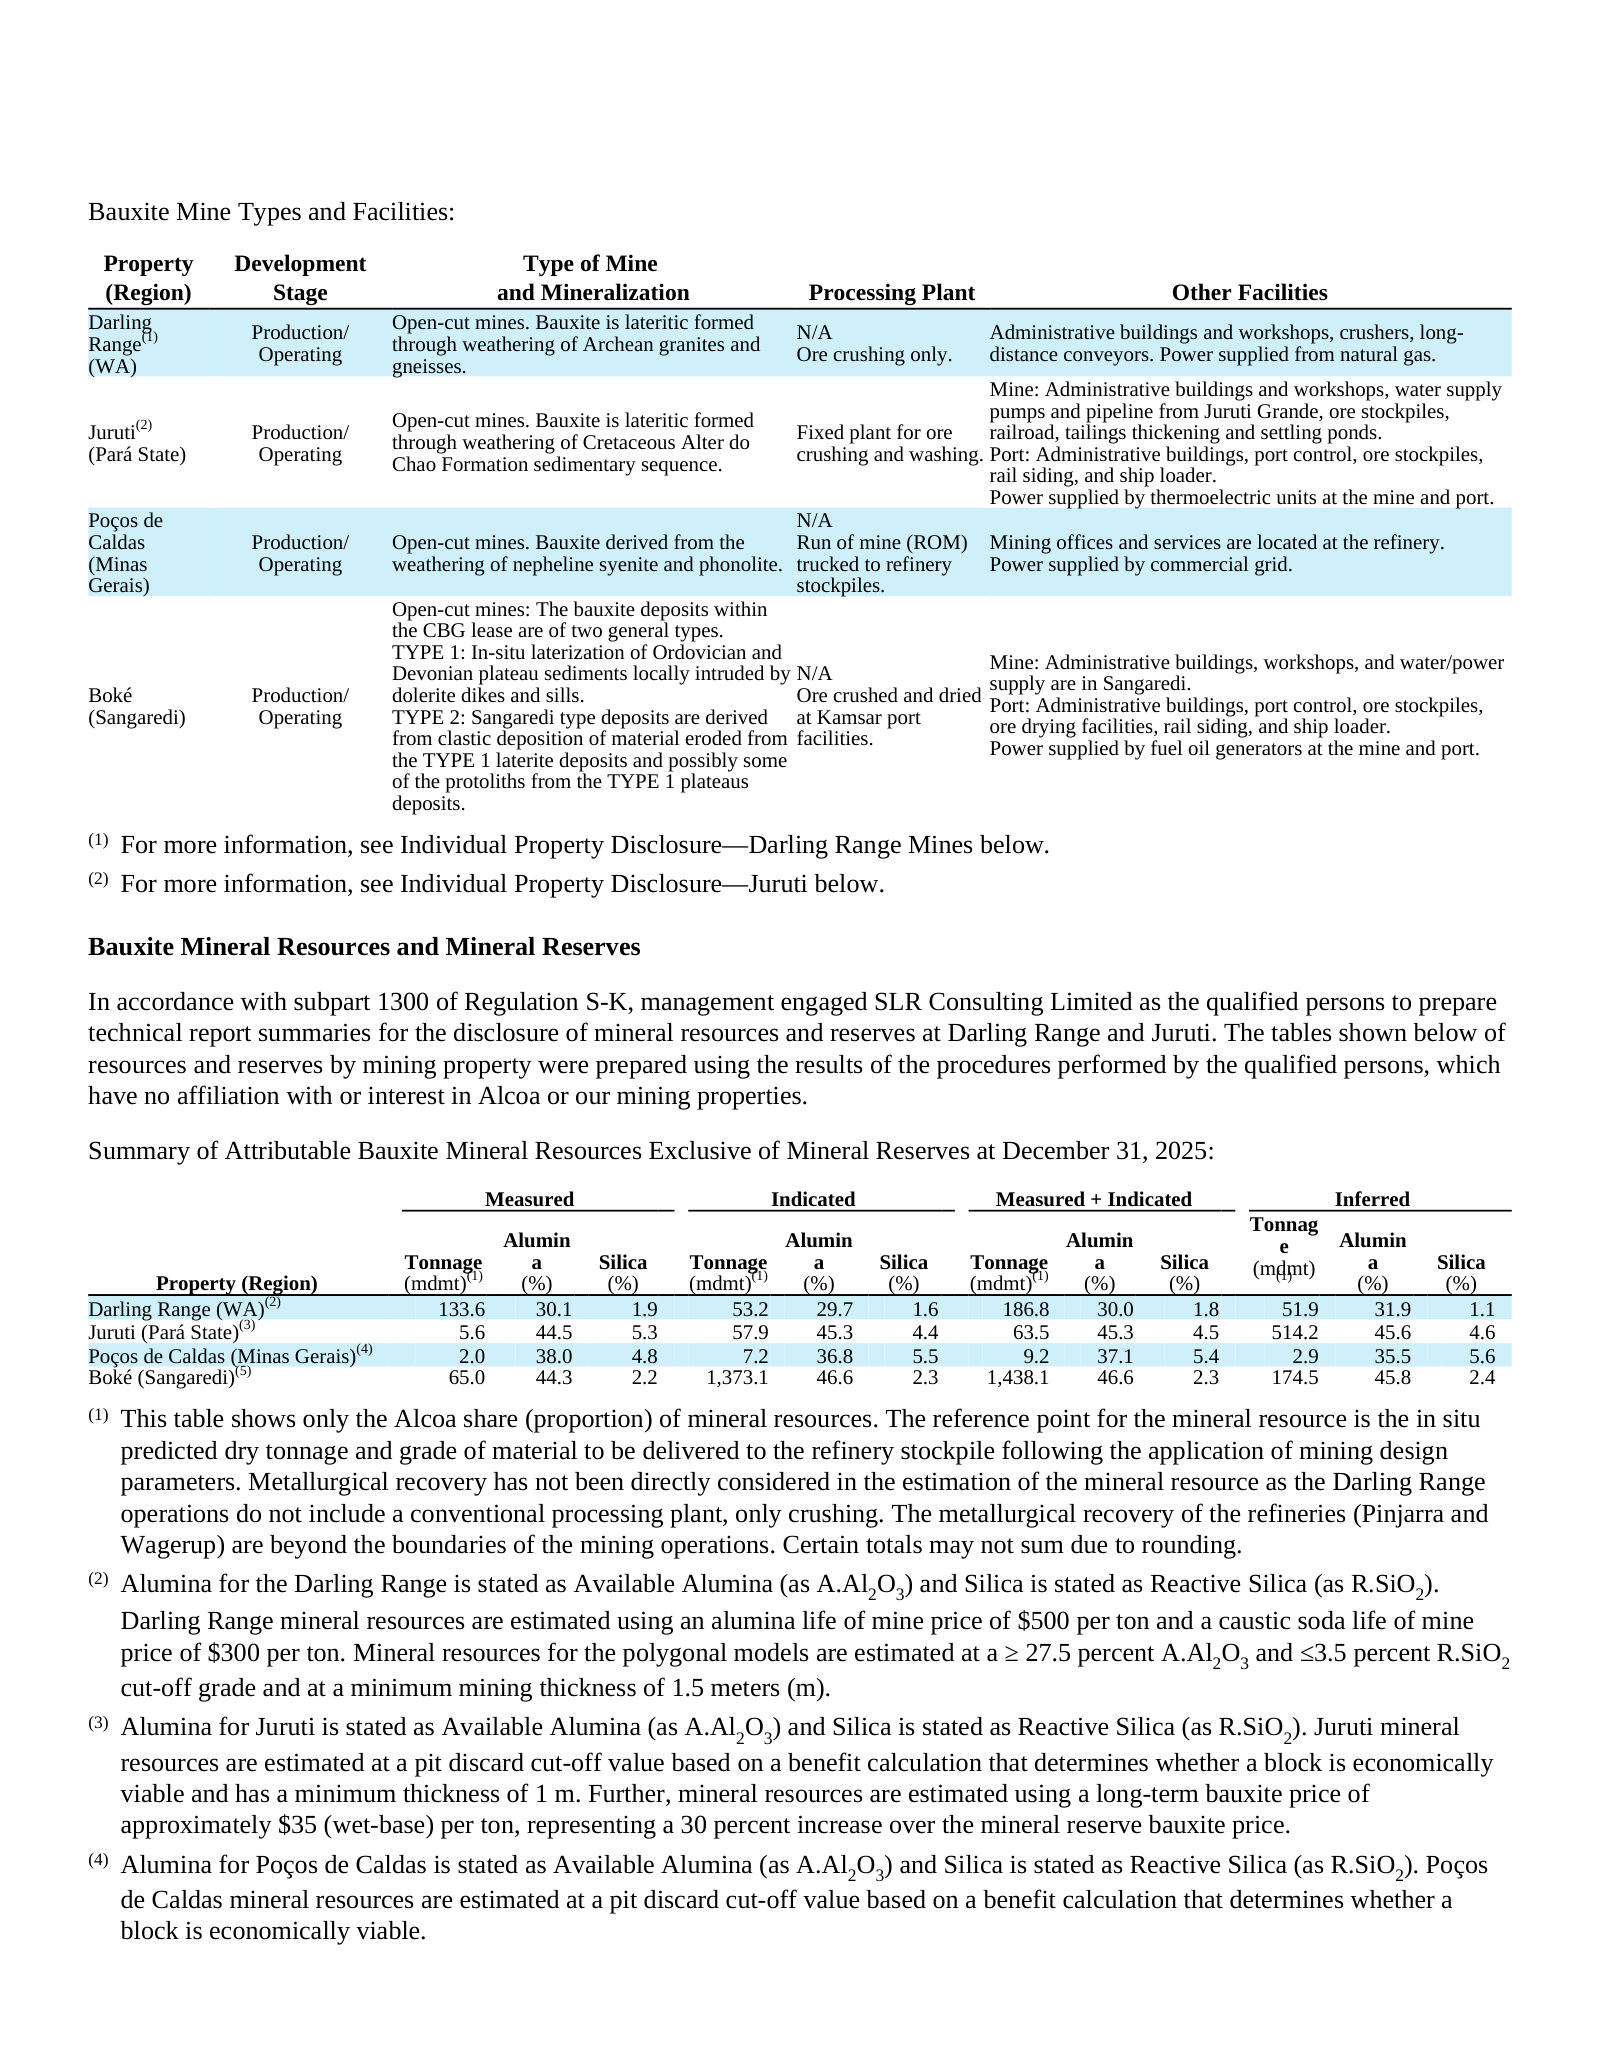
Item 7. Management's Discussion and Analysis — p. 80 · Read the full section →
Management's own read on what drove 2025 — price swings, Section 232 tariffs, and the portfolio actions reshaping the company.
Australia mine approvals: a federal strategic assessment through the 2045 lease term, with an 18-month exemption to keep mining.
In February 2026, Alcoa agreed with the Australian federal government to undertake a strategic assessment for all current and potential future mine areas (excluding Myara North and Holyoake) through the term of its existing mine lease ending in 2045 under the EPBC Act. […] The Australian federal government granted Alcoa a national interest exemption that allows Alcoa to continue its mining operations at the Huntly and Willowdale mines for 18 months while the strategic assessment is completed.
p. 84 · Read in context →
Segment Information (within MD&A) — p. 93 · Read the full section →
Where management shows how each segment earns — realized prices, unit costs, and the EBITDA split that drove consolidated results.
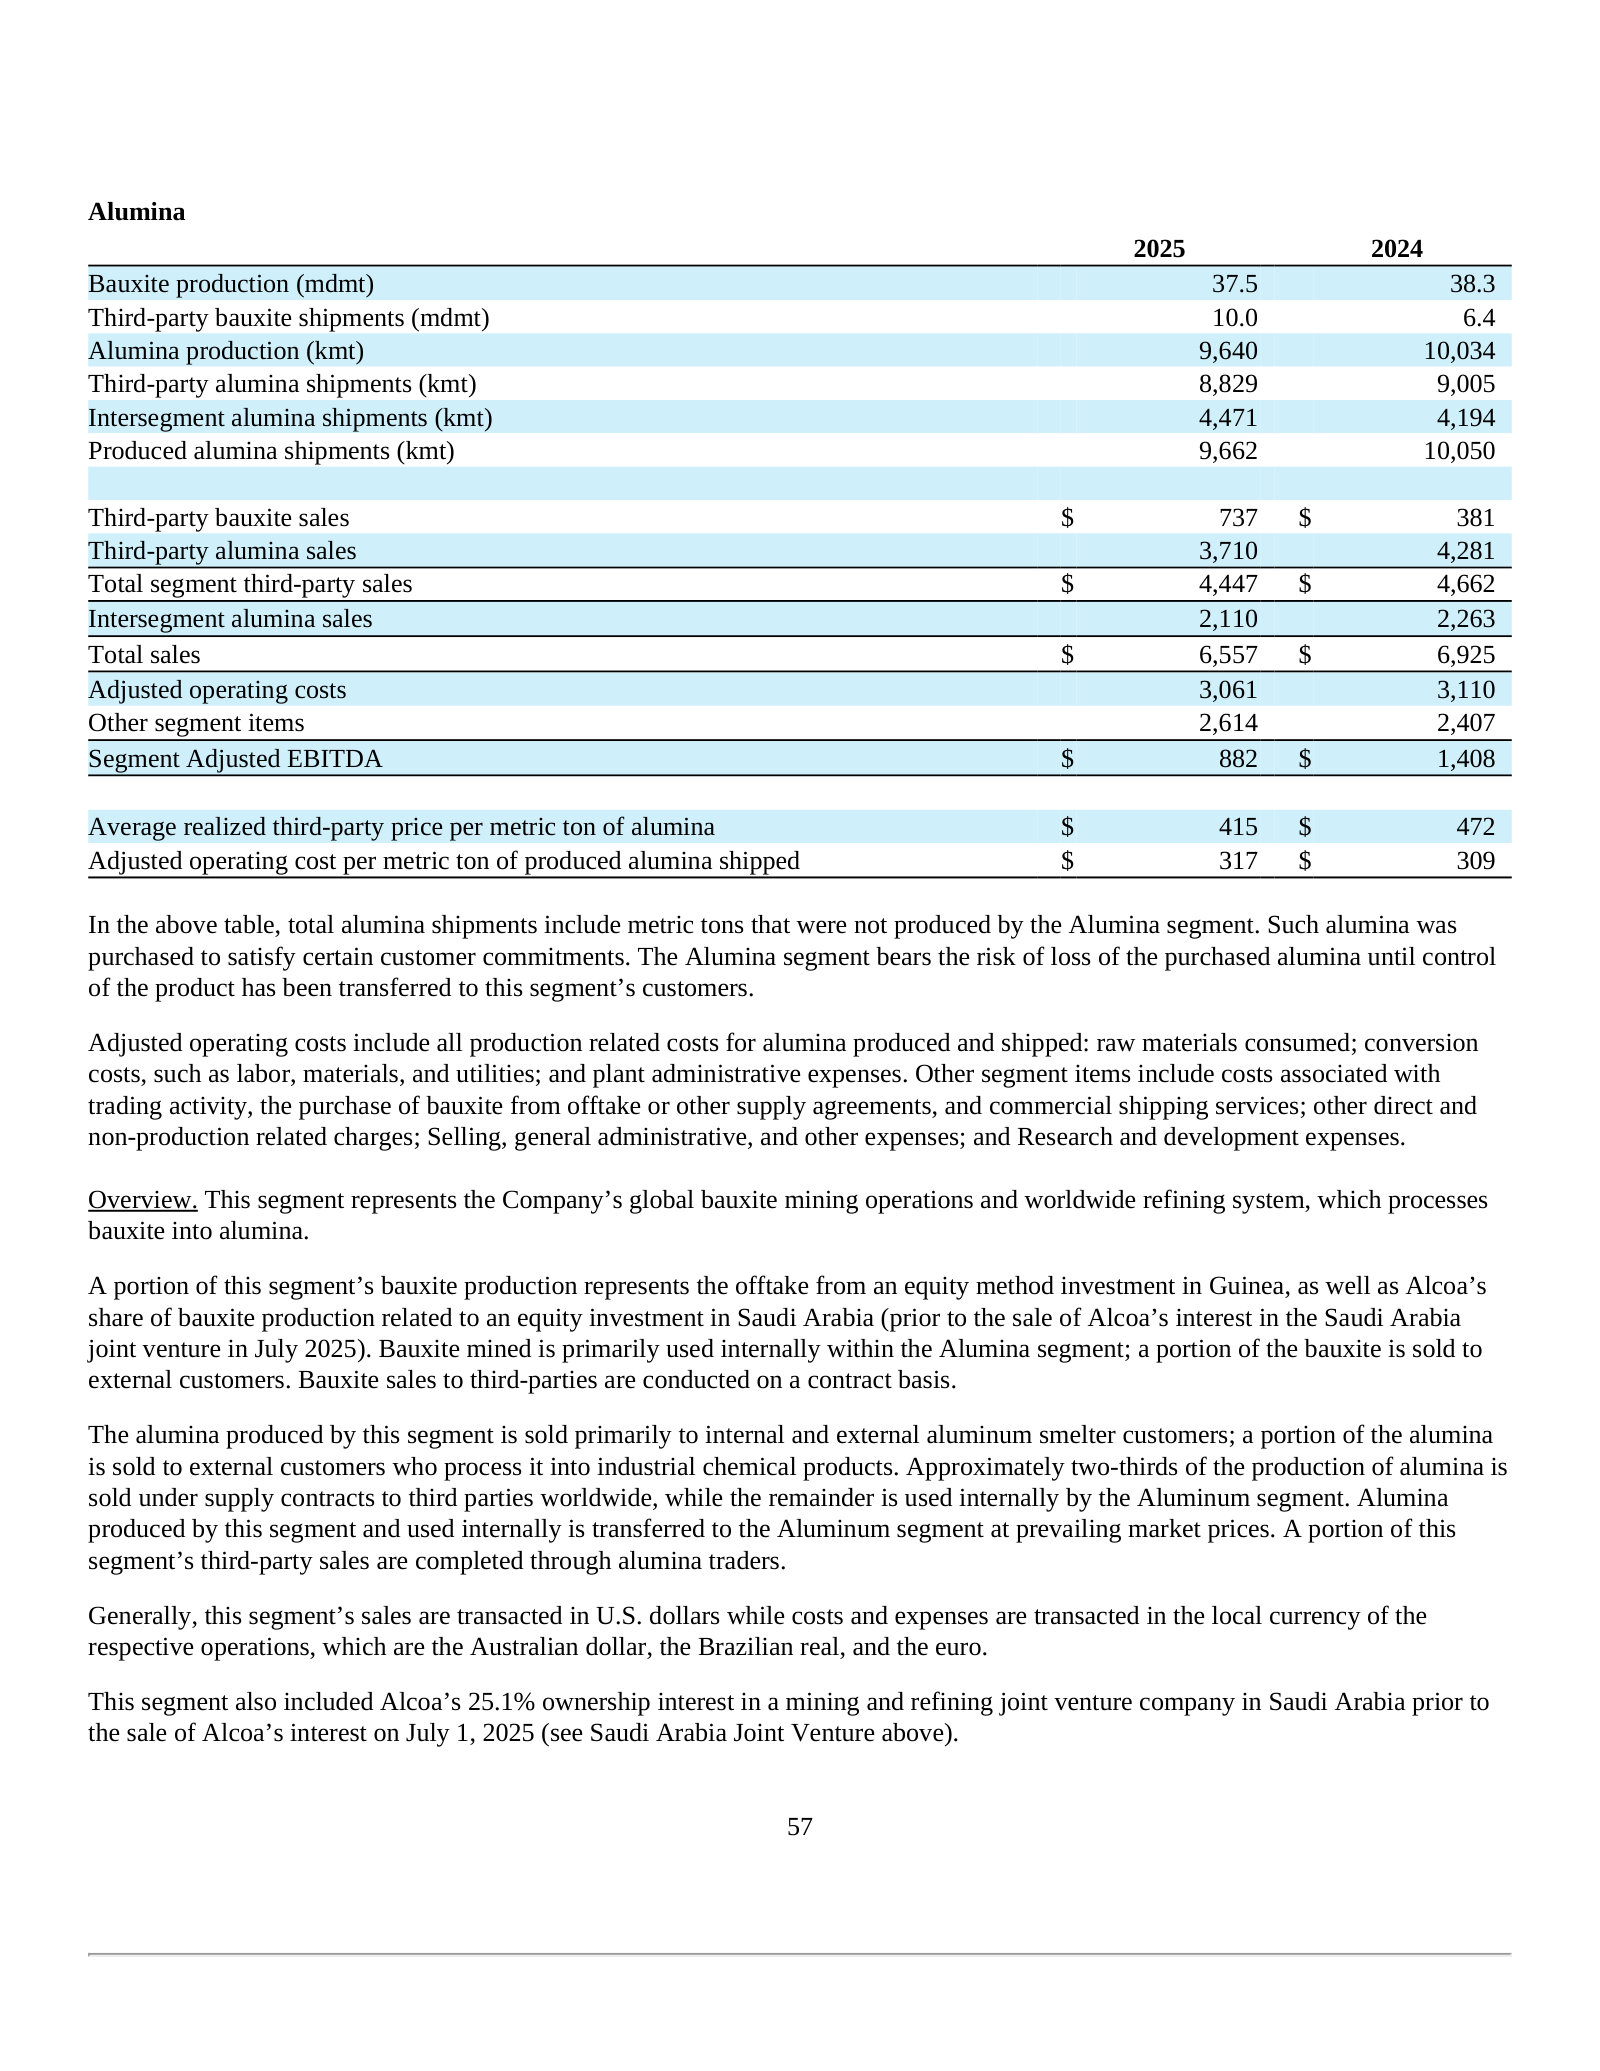
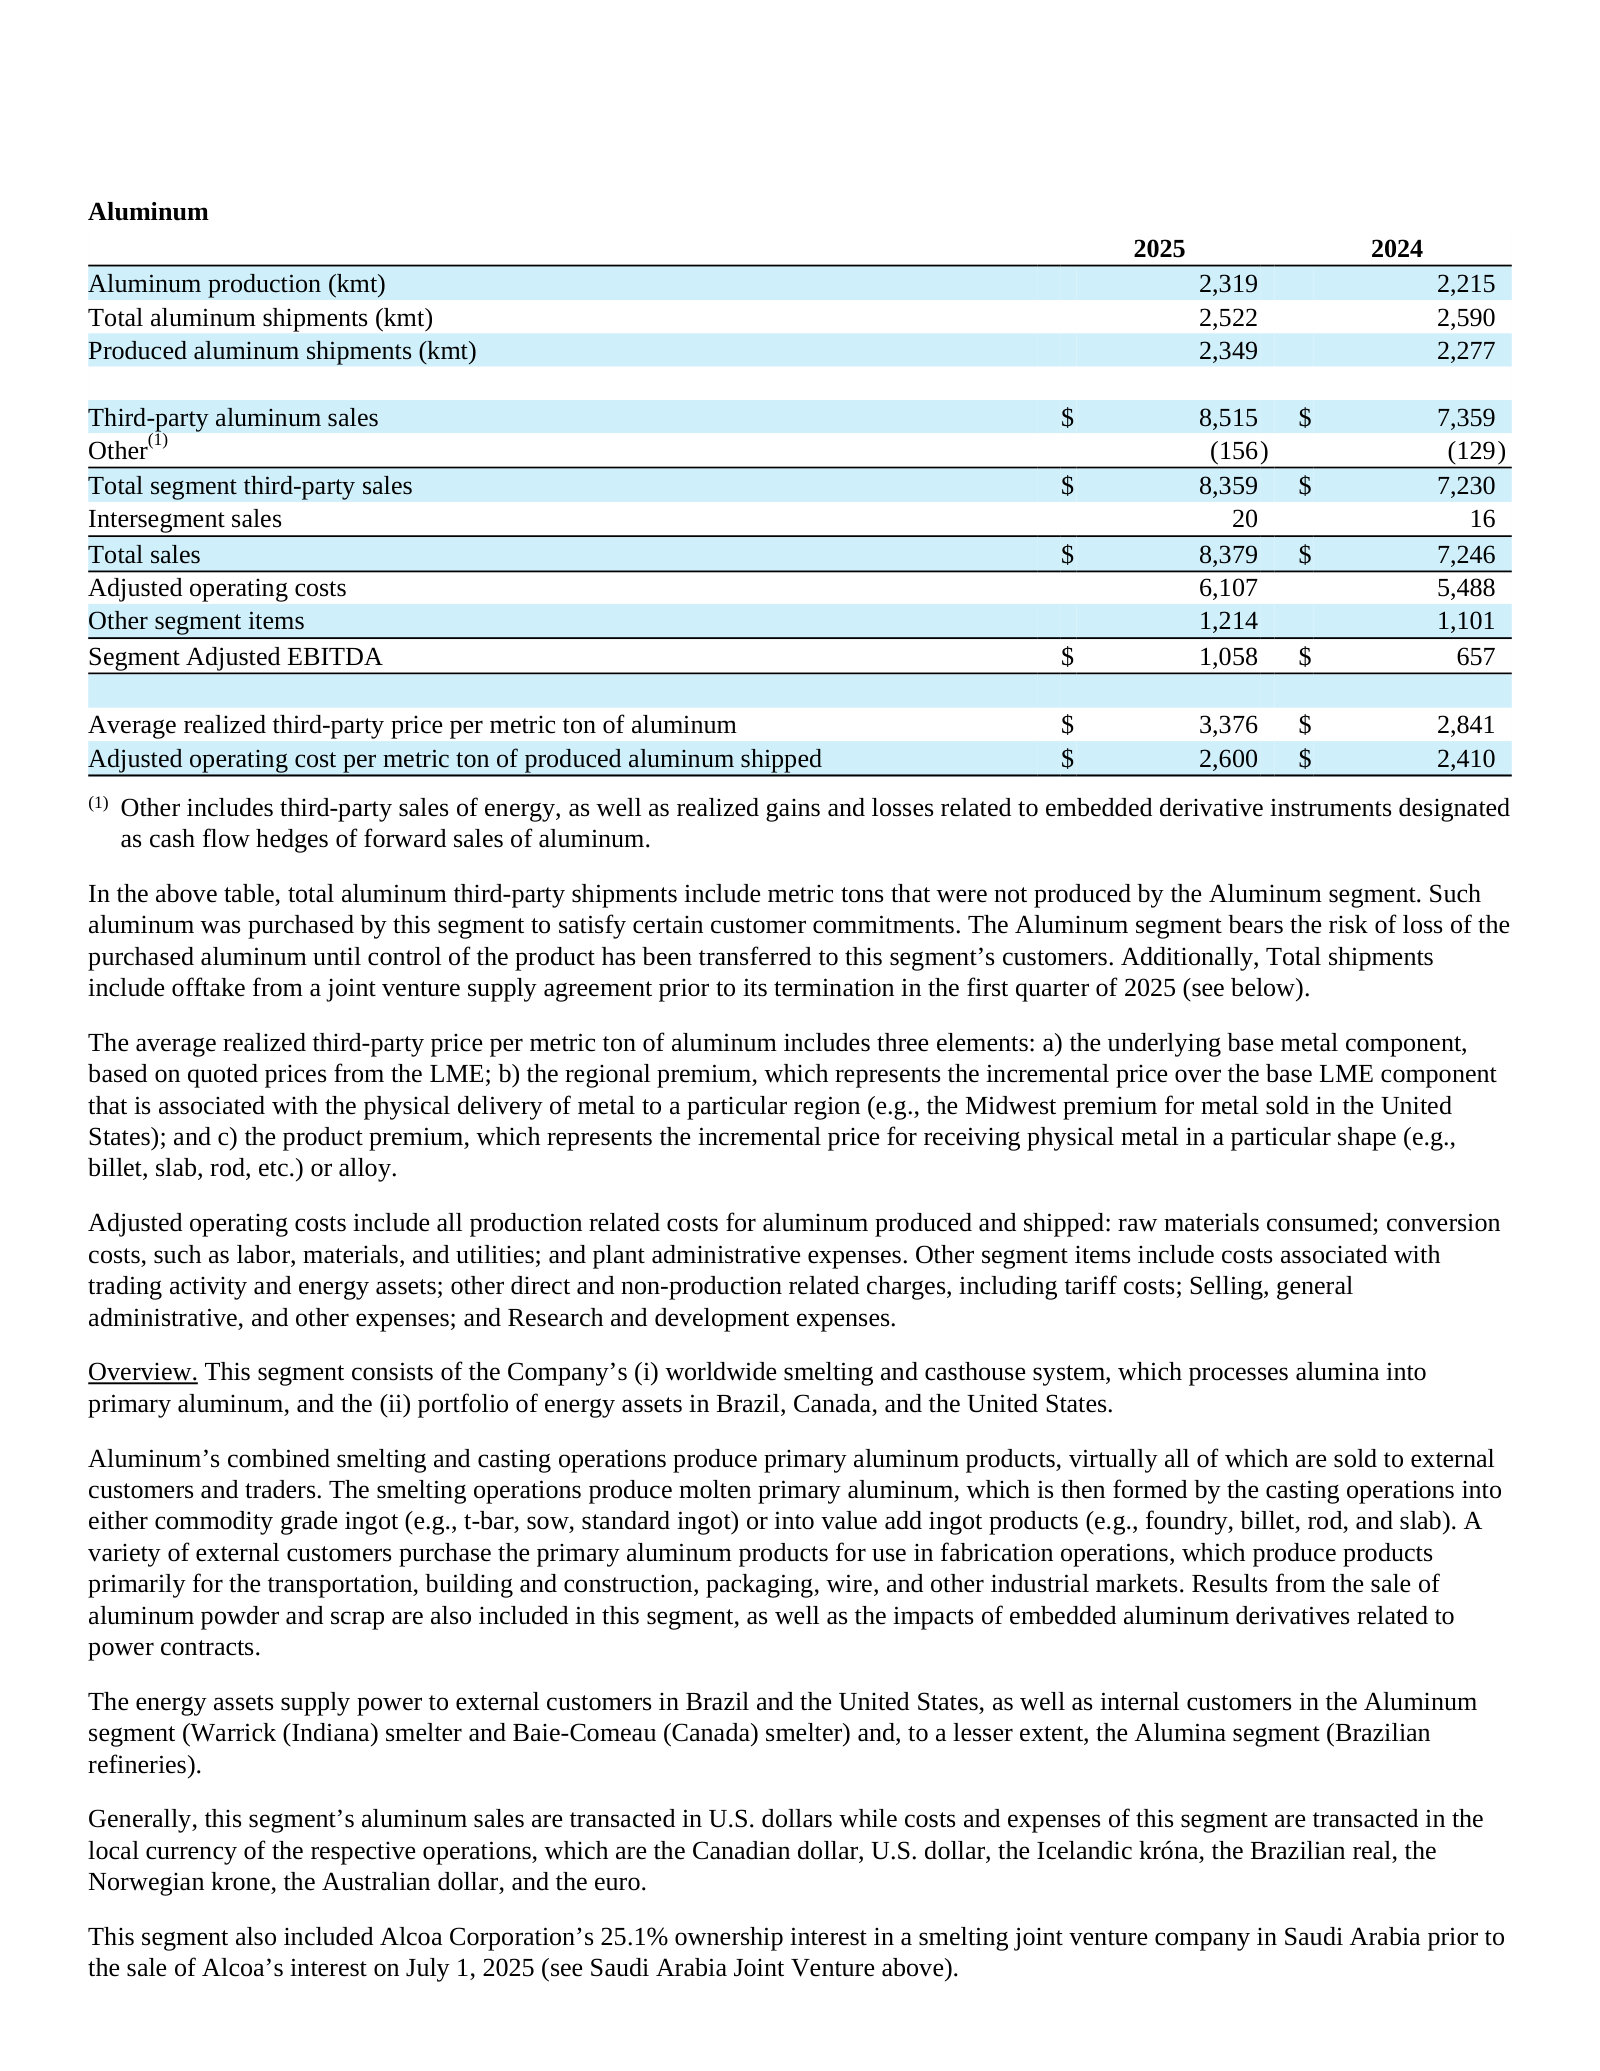
Report of Independent Registered Public Accounting Firm — p. 121 · Read the full section →
The critical audit matter isolates the accounting that defines Alcoa's economics: mine-reclamation and bauxite-residue retirement obligations.
Critical audit matter: $1,405M of asset retirement obligations for mine reclamation and closure of bauxite residue areas.
As described in Notes B and R to the consolidated financial statements, the Company recognizes asset retirement obligations (AROs) related to legal obligations associated with the standard operation of bauxite mines, alumina refineries, and aluminum smelters. […] As of December 31, 2025, the Company had $1,405 million in AROs, of which $355 million related to mine reclamation and $869 million related to the closure of bauxite residue areas.
p. 123 · Read in context →
Alcoa Corporation — FY2022 Annual Report (Form 10-K) — FY2022
The last 10-K reported under three segments — included here to see the Bauxite segment before it was folded into Alumina in 2023. · Open the full document →
Segment Information — p. 76 · Read the full section →
Shows the pre-2023 three-segment structure and management's own announcement of the redefinition into two segments.
Alcoa announces it will combine Bauxite and Alumina, moving from three reportable segments to two beginning January 2023.
Beginning in January 2023, financial information for the activities of the bauxite mines and the alumina refineries will be combined and the Company will report its financial results in the following two segments: (i) Alumina, and (ii) Aluminum. Accordingly, segment information for all prior periods presented will be updated to reflect the new segment structure in future Quarterly Report on Form 10-Q and Annual Report on Form 10-K filings.
p. 78 · Read in context →
More annual reports
Alcoa Corporation — FY2024 Annual Report (Form 10-K) — FY2024 · 240 pages · First full year of Alumina Limited consolidation and the record Q4 2024 alumina-price spike behind 2025's normalization. · Open →
Alcoa Corporation — FY2023 Annual Report (Form 10-K) — FY2023 · 250 pages · First 10-K under the new two-segment structure, with the San Ciprián and Kwinana curtailment decisions taking shape. · Open →
Alcoa Corporation — FY2021 Annual Report (Form 10-K) — FY2021 · 211 pages · Post-pandemic recovery year with peak aluminum prices — a cyclical high-water mark for comparison. · Open →
Competitors describe Alcoa Corporation's market in their own filings and calls. These verified passages and visual pages show where their strategies meet, using source documents preserved in Sources.
Century Aluminum Company (CENX)
Century is Alcoa's closest listed US pure-play primary-aluminum smelter: both sell primary metal priced off the LME plus the Midwest premium, both benefit from Section 232 import tariffs, and Century's new-smelter ambitions (an Oklahoma project with EGA) and Mt. Holly restart directly expand the domestic smelting capacity Alcoa also operates in.
Century's stated US market position and the scale of its planned 750,000-tonne Oklahoma smelter (a joint venture with Emirates Global Aluminium), measured against total US aluminum production.
Jesse Gary (President and Chief Executive Officer): At 750,000 metric tons, the new smelter will more than double total U.S. aluminum production and will restore domestic production of military-grade high-purity aluminum. […] No company is investing more to restore U.S. aluminum production than Century. Century is already the largest producer of aluminum in the United States, employing more American primary aluminum workers than any other company.
p. 4 · Read in context →
On its Q2 2025 call, Century frames a planned new US smelter and its Mt. Holly restart as large additions to domestic primary-aluminum capacity enabled by US trade policy.
Jesse Gary (President and Chief Executive Officer): It will represent the first new smelter built in the U.S. in 50 years and will double the size of the existing U.S. industry, creating over 1,000 fulltime direct jobs and over 5,500 construction jobs. […] we are very pleased to announce today that we've made the decision to restart the last 50,000 metric tonnes of capacity at Mt. Holly and return the plant to full production. […] Century's Mt. Holly expansion will increase total U.S. primary aluminum production by nearly 10%, replacing imported metal.
p. 3 · Read in context →
Century's FY2025 annual report describes the Section 232 aluminum-tariff regime and its February 2025 escalation to 25% with all country exemptions ended — the same import-tariff structure that shapes Alcoa's US metal pricing.
In March 2018, the U.S. implemented a 10% tariff on imported primary aluminum products into the U.S. These tariffs are intended to protect U.S. national security and incentivize primary aluminum production in the U.S., reducing reliance on imports and ensuring that domestic producers, like Century, can supply all the aluminum necessary for critical industries and national defense. […] All imports that directly compete with our products are covered by the tariff. In February 2025, President Trump issued a new Presidential Proclamation directing the tariff rate on imported primary aluminum to be increased from 10% to 25% and for all existing country exemptions or product exclusion to be ended, in each case effective March 12, 2025.
p. 40 · Read in context →
Norsk Hydro ASA (NHY)
Norsk Hydro spans the same value chain as Alcoa — bauxite mining, alumina refining, primary-aluminum smelting, recycling and captive renewable power — and competes directly in alumina supply, primary metal, and low-carbon/recycled aluminum products; its own shareholder-return peer group names Alcoa.
Hydro's stated position in primary aluminum — the ex-China sixth-largest producer with about 2.1 million tonnes of annual capacity — the segment that competes head-on with Alcoa's Aluminum business.
Hydro Aluminium Metal is the world's (excluding China) sixth largest producer and supplier of primary aluminium and value added casthouse products. […] Hydro's total annual primary aluminium capacity is about 2.1 million tonnes.
p. 24 · Read in context →
Hydro's description of its alumina refining scale: its 62%-owned Alunorte in Brazil, which it calls the largest alumina refinery outside China at 6.3 million tonnes nameplate — a direct point of comparison to Alcoa's Alumina segment.
Alunorte is the biggest alumina refinery in the world outside China, with nameplate capacity of 6.3 million tonnes per year.
p. 22 · Read in context →
Hydro's stated view of the 2025 alumina market: a rebalancing (production growth of 3.1% against demand growth of 1.8%) and a Platts alumina index falling from USD 672 to USD 306 per tonne — the shared alumina market Alcoa also sells into.
Following very tight alumina markets and all time high nominal prices in 2024, the global metallurgical alumina market rebalanced in 2025: production growth of 3.1 percent exceeded demand growth of 1.8 percent, driving prices lower throughout the year. The Platts alumina price index started the year at USD 672 per mt and decreased throughout the year, ending the year at the annual low of USD 306 per mt.
p. 34 · Read in context →
Rio Tinto (RIO)
Rio Tinto's Aluminium division is a vertically integrated bauxite, alumina and primary-aluminium producer competing directly with Alcoa across the same value chain — and the two co-own the ELYSIS inert-anode smelting joint venture, making Rio simultaneously a rival and a partner in low-carbon aluminum.
Rio Tinto describes ELYSIS — its inert-anode, zero-direct-emissions smelting joint venture with Alcoa — and a 2024 decision to build a 10-pot, 2,500-tonne-per-year demonstration plant at its Arvida smelter.
Our ELYSIS joint venture with Alcoa is progressing the development of a breakthrough inert anode technology that eliminates all direct greenhouse gas (GHG) emissions from the aluminium smelting process. In 2024, we announced […] a demonstration plant equipped with 10 ELYSIS pots at our Arvida smelter. […] The demonstration plant will have the capacity to produce up to 2,500 tonnes of aluminium per year, with first production targeted by 2027.
p. 106 · Read in context →
Rio Tinto reports a 61% rise in its Aluminium segment's 2024 underlying EBITDA (a 30% margin) and cites record bauxite output at Gove and Amrun, sizing the integrated bauxite-alumina-aluminium business that overlaps Alcoa's.
Overall we delivered a significant uplift in profitability for our Aluminium business with a 61% increase in underlying EBITDA […] underlying EBITDA margin rising nine percentage points to 30% and underlying ROCE of 10%. […] Higher bauxite volumes from record annual production at Gove and Amrun and increased bauxite pricing were partially offset by lower alumina production following the breakage of a third-party gas pipeline in Queensland.
p. 106 · Read in context →
Rio Tinto's self-description as a "global leader in low-carbon aluminium" and its sizing of aluminium demand drivers — a market-framing claim that overlaps Alcoa's own low-carbon positioning (Rio's own framing).
As a global leader in low-carbon aluminium, we are uniquely positioned to further decarbonise our business and support the world's transition towards a lower carbon footprint. […] World semi-fabricated demand rose 2% year-on-year. Primary aluminium demand increased at a similar rate. […] Global aluminium demand will continue to be driven by the energy transition, particularly electric vehicles, and renewable energy.
p. 105 · Read in context →
Aluminum Corporation of China Limited (Chalco) (2600.HK)
Chalco is the world's largest alumina producer and among the largest primary-aluminum producers, vertically integrated from bauxite mining through alumina refining, smelting and power — the same value chain as Alcoa's Alumina and Aluminum segments — competing in global alumina supply, primary metal, bauxite resources and lower-carbon smelting.
Chalco cites Alcoa's Kwinana alumina closure by name among the 2024 supply disruptions it says lifted alumina prices, which it reports averaged USD502/tonne, up 46% year on year.
In April, due to the decline in ore grade and high costs of outdated equipment, Alcoa shut down its Kwinana alumina plant in Western Australia, affecting production capacity of approximately 1.8 million tonnes per year. […] In 2024, the highest international alumina (FOB) price was USD810/tonne, the lowest was USD354/tonne, and the average price was USD502/tonne, representing a year-on-year increase of 46%.
p. 50 · Read in context →
Chalco's stated global ranking across the aluminum value chain, from its FY2025 corporate profile (the company's own self-description).
The Company and its subsidiaries (the “Group”) is a leading enterprise in aluminum industry in China, ranking among the top in the global aluminum industry in terms of overall strengths. The Group’s alumina, fine alumina, electrolytic aluminum, high purity aluminum and gallium metal production capacity all rank first in the world, and is a large manufacturer and operator with integration of exploration and mining of bauxite, coal and other resources; production, sales and technology research of alumina, primary aluminum, aluminum alloy and carbon; international trade; logistics business; thermal and new energy power generation.
p. 4 · Read in context →
Chalco's stated bauxite-reserve additions and lower-carbon smelting strategy — adding 73.55 million tonnes of new resources and lifting clean-energy use in electrolytic aluminum to 45.5%.
The Company has focused on the extra strong capability in mineral resources, promoted the exploration and development of bauxite resources, increased reserves and production, and added 73.55 million tonnes of new resources throughout the year; […] the Company’s clean energy consumption in electrolytic aluminum projects accounted for 45.5%, maintaining a leading level in the industry […]
p. 55 · Read in context →
Vedanta Limited (VEDL)
Vedanta Aluminium — the Jharsuguda and BALCO/Korba smelters and the Lanjigarh alumina refinery — is India's largest primary-aluminum producer, and is expanding smelting capacity while backward-integrating into bauxite, alumina and captive coal, competing with Alcoa on the same bauxite-to-metal cost curve and low-carbon 'Restora' positioning.
Vedanta's stated aluminium capacity-expansion and backward-integration plan: adding 435 KTPA of Korba smelter capacity toward 1 MTPA, scaling the Lanjigarh alumina refinery from 2 to 5 MTPA, and targeting first output from the Sijimali bauxite mine in H1 FY2026-27.
Aluminium Volume: Through BALCO's Growth Project, the company is well positioned to add 435 KTPA of smelter capacity, increasing the total capacity at Korba to 1 MTPA. […] BALCO has also marked a key milestone with the first metal production from India's largest 525 kA smelter. […] Backward Integration: Lanjigarh refinery has successfully commissioned its expansion from 2 to 5 MTPA, producing its first alumina from Train‑1 in March 2024 and from Train‑2 in October 2025. […] We are also on track for commissioning the Sijimali Bauxite mine within H1 FY 2026‑27.
p. 133 · Read in context →
Vedanta's FY2025-26 aluminium output and cost-security disclosure: record 2,456 kt of aluminum, 2.92 million tonnes of calcined alumina at Lanjigarh (exit run-rate 4 MTPA), and captive coal blocks intended to give its aluminum business full coal security.
At Lanjigarh, Calcined alumina production for the year was at 2.92 million tonnes, up 48% Y-o-Y. The ramp-up remains on track with achievement of exit run rate of 4 MTPA in March. […] Cumulative Aluminium production for the year was the highest-ever at 2,456 kt, up 1% Y-o-Y. […] Post commencement, these captive mines will ensure 100% coal security for our Aluminium business.
p. 131 · Read in context →
More peer documents
Century Aluminum — Q3 2025 earnings call — Q3 2025 · 8 pages · Management gives realized LME ($2,508/t) and Midwest premium ($1,425/t) prints, credits Section 232 for a 'new future' for US aluminum, and notes alumina/raw-material cost dynamics — a direct read-across to Alcoa's pricing. · Open →
Century Aluminum — Q4 2025 earnings call — Q4 2025 · 9 pages · Management projects a global aluminum deficit into 2026, a rising Midwest premium, tariff-free EU access for its Icelandic Grundartangi metal, and plans to invest 'billions more' under Section 232 — competitive-landscape signals Alcoa shares. · Open →
Century Aluminum — FY2024 annual report — FY2024 · 117 pages · Prior-year 10-K describing LME-plus-premium pricing and Century's 55% Jamalco bauxite-mining and alumina-refining venture in Jamaica — a vertical-integration overlap with Alcoa's upstream. · Open →
Norsk Hydro — FY2024 annual report — FY2024 · 283 pages · Prior-year baseline for aluminum/alumina demand and pricing, the REDUXA low-carbon brand, and another explicit Alcoa reference — useful for year-over-year framing. · Open →
Rio Tinto — FY2025 annual report — FY2025 · 769 pages · FY2025 ELYSIS update (first industrial-scale 450 kA inert-anode cell at Alma) plus renewable PPAs to repower the Pacific Aluminium smelters — the next milestones in the Alcoa-Rio low-carbon smelting rivalry. · Open →
Rio Tinto — full-year 2024 results call — FY2024 · 45 pages · Management's spoken commentary on the aluminium, bauxite and alumina business and its decarbonisation path — an exec-voice complement to the annual-report exhibits. · Open →
Source: S&P Capital IQ consensus via Xpressfeed · Generated 2026-08-01.
Alcoa's consensus tape has rolled over: after a strong six-month run-up, FY27 normalized-EPS estimates were cut roughly 18% in the past 30 days, and the company has now missed both revenue and normalized EPS for two straight quarters. Dispersion on the out-years is extreme, with 2027 EPS estimates spanning $2.74 to $9.17, reflecting how much operating leverage rides on the aluminum price. The Street stays net constructive at 7 buy versus 5 hold. All figures are consensus means in USD, and outer-year coverage thins quickly.
Estimate momentum
Currency: USD · Scale: money in millions, absolute · Point-in-time consensus; Δ90d is Now versus 90d.
| Metric | FY | 180d | 90d | 30d | Now | Δ90d |
|---|---|---|---|---|---|---|
| EPS (normalized) | FY2027 | $5.23 | $6.70 | $7.22 | $5.93 | -11.4% |
| EPS (normalized) | FY2028 | $5.41 | $6.74 | $7.65 | $7.04 | +4.5% |
| Revenue | FY2027 | $13.93bn | $15.03bn | $15.37bn | $15.22bn | +1.2% |
| Revenue | FY2028 | $14.24bn | $14.94bn | $15.06bn | $14.39bn | -3.7% |
Two straight quarters of revenue and EPS misses after a run of big EPS beats
Current sequences by metric: Revenue: 2 consecutive misses; EPS (normalized): 2 consecutive misses.
Currency: USD · Scale: money in millions, absolute · Consensus is captured before each actual first became effective.
| Quarter | Metric | Consensus | Actual | Surprise | Outcome |
|---|---|---|---|---|---|
| Q2 FY2026 | Revenue | $4.16bn | $3.97bn | -4.6% | Miss |
| Q2 FY2026 | EPS (normalized) | $2.19 | $2.12 | -3.2% | Miss |
| Q1 FY2026 | Revenue | $3.27bn | $3.19bn | -2.3% | Miss |
| Q1 FY2026 | EPS (normalized) | $1.55 | $1.40 | -9.6% | Miss |
| Q4 FY2025 | Revenue | $3.27bn | $3.45bn | +5.4% | Beat |
| Q4 FY2025 | EPS (normalized) | $1.01 | $1.26 | +24.7% | Beat |
| Q3 FY2025 | Revenue | $3.13bn | $3.00bn | -4.3% | Miss |
| Q3 FY2025 | EPS (normalized) | $0.01 | -$0.02 | -350.0% | Miss |
| Q2 FY2025 | Revenue | $2.95bn | $3.02bn | +2.3% | Beat |
| Q2 FY2025 | EPS (normalized) | $0.39 | $0.39 | +1.1% | Beat |
| Q1 FY2025 | Revenue | $3.49bn | $3.37bn | -3.6% | Miss |
| Q1 FY2025 | EPS (normalized) | $1.34 | $2.15 | +60.2% | Beat |
| Q4 FY2024 | Revenue | $3.45bn | $3.49bn | +1.0% | Beat |
| Q4 FY2024 | EPS (normalized) | $1.01 | $1.04 | +2.8% | Beat |
| Q3 FY2024 | Revenue | $2.95bn | $2.90bn | -1.7% | Miss |
| Q3 FY2024 | EPS (normalized) | $0.30 | $0.57 | +92.2% | Beat |
2027 barely a consensus: normalized EPS spans $2.74 to $9.17 across 11 analysts
Even with 10 to 12 analysts, FY27 EBITDA ranges from about $2.2bn to $4.4bn and revenue from about $13.2bn to $17.3bn; the mean is a weak anchor here.
Currency: USD · Scale: money in millions, absolute · Spread/mean is absolute high-low divided by absolute mean.
| Metric | Period | Mean | Low–high | Spread/mean | Analysts |
|---|---|---|---|---|---|
| EPS (normalized) | FY2027E | $5.93 | $2.74–$9.17 | 108.4% | 11 |
| EBITDA | FY2027E | $3.14bn | $2.22bn–$4.43bn | 70.3% | 10 |
| Revenue | FY2027E | $15.22bn | $13.19bn–$17.26bn | 26.7% | 12 |
Forward shape: revenue growth fades after FY26 while free cash flow keeps building
Consensus has revenue up roughly 16% in FY26 then flat-to-down through FY28, EBITDA plateauing near $3bn, and free cash flow rising each year; note FY28 normalized EPS rests on just five analysts.
Currency: USD · Scale: money in millions, absolute · YoY uses the prior fiscal year from the feed; analyst count and range use the first displayed period.
| Metric | FY2026E | FY2027E | FY2028E | YoY | Analysts | Low / high |
|---|---|---|---|---|---|---|
| Revenue | $14.85bn | $15.22bn | $14.39bn | +15.7% | 12 | $14.31bn / $15.71bn |
| EBITDA | $3.02bn | $3.14bn | $2.99bn | +52.4% | 10 | $2.79bn / $3.23bn |
| EPS (normalized) | $6.65 | $5.93 | $7.04 | +76.4% | 10 | $6.13 / $7.25 |
| Free cash flow | $879.99m | $1.57bn | $1.90bn | +64.9% | — | — |
Street stays net constructive: 7 buy, 5 hold, one underperform; targets $49.70-$80
Twelve price targets average about $63 (median $59.50) against a low of $49.70 and a high of $80; this feed carries no current share price, so read the spread as sentiment, not implied upside.
Currency: USD · Scale: money in millions, absolute · Analyst counts shown explicitly.
| Street view | Reading | Analysts |
|---|---|---|
| Recommendation mix | Buy 7, Outperform 0, Hold 5, Underperform 1, Sell 0 | 13 |
| Consensus score | 2.00 | 13 |
| Target price | mean $62.98; median $59.50; high $80.00; low $49.70 | 12 |
Coverage thins sharply beyond FY28
FY29 revenue is a three-analyst figure and FY29 EBITDA and GAAP EPS rest on a single estimate each; I stopped the forward table at FY28 for that reason.
Visible Alpha broker models via S&P Xpressfeed · 10 brokers · 394 line items · freshest revision 2026-07-20.
Roughly ten broker models frame Alcoa as a mix-shift story: consensus total segment EBITDA nearly doubles from FY-2025 to about $3.4bn in FY-2026, driven almost entirely by the Aluminium segment as a tariff-inflated Mid-West premium roughly triples its earnings, while the Alumina segment swings to a modeled loss. The upshot is a fast build in free cash flow and a swing to net cash. Headline P&L and EPS consensus live on the CapIQ tab; this tab reads the segment and per-tonne detail underneath it.
Aluminium is the profit engine; Alumina swings to a modeled loss in FY-2026
| Line | FY-2025A | FY-2026E | FY-2027E | FY-2028E | YoY | Brokers |
|---|---|---|---|---|---|---|
| Segment EBITDA | — | — | — | — | — | — |
| Adjusted EBITDA - Aluminium | $1.05bn | $3.63bn | $3.57bn | $3.12bn | +244.8% | 10 |
| Adjusted EBITDA - Alumina segment | $921.78m | $-310.62m | $7.99m | $245.28m | -133.7% | 9 |
| Adjusted EBITDA - Corporate | $-2.94m | $-289.50m | $-290.36m | $-272.73m | -9730.3% | 10 |
| Adjusted EBITDA - Total segment | $1.98bn | $3.36bn | $3.65bn | $3.44bn | +70.2% | 10 |
Why the mix flipped: a tariff-driven aluminium premium vs. sub-cost alumina prices
The Mid-West premium nearly doubles to about $2,342/t in FY-2026, lifting Aluminium EBITDA to roughly $1,337/t. Alumina's realized price near $338/t drops below its cash cost near $405/t, pushing per-tonne EBITDA negative before a partial FY-2028 recovery.
| Line | FY-2025A | FY-2026E | FY-2027E | FY-2028E | YoY | Brokers |
|---|---|---|---|---|---|---|
| Aluminium ($/t) | — | — | — | — | — | — |
| Aluminum premium - Mid-West ($/t)($) | $1,247 | $2,342 | $2,133 | $1,687 | +87.8% | 7 |
| Average realized price per metric ton - Aluminium($) | $3,341 | $4,479 | $4,392 | $4,148 | +34.1% | 8 |
| Cash cost per metric ton - Aluminium($) | $2,915 | $3,127 | $3,118 | $3,080 | +7.3% | 9 |
| Adjusted EBITDA per metric ton - Aluminium($) | $421.4 | $1,337 | $1,297 | $1,121 | +217.3% | 9 |
| Alumina ($/t) | — | — | — | — | — | — |
| Average realized price per metric ton- Alumina($) | $418.4 | $337.5 | $361.3 | $373.4 | -19.3% | 9 |
| Cash cost per metric ton - Alumina($) | $370.4 | $404.6 | $391.7 | $391.1 | +9.2% | 5 |
| Adjusted EBITDA per metric ton - Alumina($) | $68.56 | $-33.27 | $-7.98 | $8.48 | -148.5% | 5 |
Where brokers split: premium durability and Alumina's recovery, not the near term
| Line | Period | Median | Q1–Q3 | Min–max | Brokers |
|---|---|---|---|---|---|
| Aluminum premium - Mid-West ($/t)($) | FY-2028E | $1,750 | $1,526–$1,915 | $837.8–$2,340 | 7 |
| Adjusted EBITDA - Alumina segment | FY-2027E | $23.95m | $-100.87m–$303.36m | $-826.85m–$633.98m | 9 |
| Adjusted EBITDA - Aluminium | FY-2028E | $3.67bn | $2.15bn–$3.86bn | $1.53bn–$4.38bn | 9 |
The earnings jump converts to rising FCF and a swing to net cash by FY-2027
Consensus free cash flow rises from about $0.9bn in FY-2026 to roughly $1.5bn in FY-2027, and modeled net debt swings from about $1.0bn in FY-2025 to a net-cash position by FY-2027 (around -$0.8bn) and about -$1.9bn by FY-2028. Models leave that capacity largely unallocated, with per-share dividends still near zero.
Thin coverage on Bauxite and per-tonne Alumina economics
Bauxite adjusted EBITDA rests on only two brokers, and the Alumina per-tonne cash-cost and realized-price lines on four to five, versus nine to ten on the aluminium and group lines. Bauxite's median realized price also sits at a flat $20/bdmt against a higher mean, so treat these as one or two analysts' views rather than consensus.
Headline P&L consensus, momentum and beat/miss live in the CapIQ tab.
Source: S&P Capital IQ transcripts via Xpressfeed · latest indexed call 2026-07-16 · generated 2026-08-01.
Latest call digest
Alcoa Corporation, Q2 2026 Earnings Call, Jul 16, 2026 · 2026-07-16T21:00:00
Q2 2026 — July 16, 2026. The prepared remarks led with the headline that dominated the quarter: the agreed acquisition of South32's upstream bauxite, alumina and aluminum assets ("AliGroup") for $3.1 billion cash and $1 billion in equity, framed as the largest transaction in Alcoa's history with roughly $900 million of identified NPV synergies and a pro forma ~53% lift in alumina and ~37% lift in aluminum capacity. Management also reported record quarterly revenue of $4 billion and adjusted EBITDA of $901 million, with the Aluminum segment at record profitability. The Q&A reality was more mixed. Molly Beerman acknowledged reported results were modestly below consensus on a late-June LME drop, and the company lowered full-year alumina production and shipment guidance after operational instability at the Pinjarra refinery (an oxalate outbreak compounded by a cyclone-driven natural-gas curtailment). On Western Australia mine approvals, Bill Oplinger said his confidence in the outcome is unchanged but that timing could now extend beyond the year-end target. Guidance actually stated: Q3 Alumina segment net favorable ~$10 million and Aluminum roughly flat; full-year other corporate expense raised to ~$180 million and depreciation to ~$660 million; Q3 operational tax ~$80-90 million; and asset monetization still targeted at $500 million to $1 billion by 2030.
Participant coverage from the latest call.
| Group | Participants | Count |
|---|---|---|
| Management | Operator; Louis Langlois — Senior Vice President of Treasury & Capital Markets, Alcoa Corporation; William Oplinger — President, CEO & Director, Alcoa Corporation; Molly Beerman — Executive VP & CFO, Alcoa Corporation | 4 |
| Analysts | Katja Jancic — Analyst, BMO Capital Markets Equity Research; Bennett Moore — Analyst, JPMorgan Chase & Co, Research Division; Henry Hearle — Analyst, B. Riley Securities, Inc., Research Division; Timna Tanners — Managing Director of Equity Analyst, Wells Fargo Securities, LLC, Research Division; Glyn Lawcock — Head of Resources and Mining Research, Barrenjoey Markets Pty Limited, Research Division; Christopher LaFemina — Senior Equity Research Analyst, Jefferies LLC, Research Division; Carlos de Alba — Equity Analyst, Morgan Stanley, Research Division; Lawson Winder — VP & Research Analyst, BofA Securities, Research Division; John Tumazos — President & Chief Executive Officer, John Tumazos Very Independent Research, LLC | 9 |
Curated latest-call exchanges; one row per analyst topic.
| Analyst | Firm | Topic | What changed in Q&A |
|---|---|---|---|
| Timna Tanners | Wells Fargo Securities | Aluminum price retreat and China supply | Oplinger attributed the pullback to pre-conflict levels to sentiment rather than changed fundamentals, and said China is now running above its 45mt cap without signaling a policy change. |
| Glyn Lawcock | Barrenjoey | Western Australia mine-approval timing | After five weeks in Australia, Oplinger reaffirmed confidence in securing approvals but flagged that timing could extend beyond the year-end target, citing a built-in six-month contingency. |
| Christopher LaFemina | Jefferies | Depreciation and mine-life change | Pressed on why depreciation guidance rose on shorter assumed asset lives; management did not identify the specific assets driving the change. |
| Carlos de Alba | Morgan Stanley | Alumina Q3 sequential bridge and Pinjarra normalization | Beerman walked through a full $30 million Pinjarra recovery, partly offset by planned Alumar refinery and Juruti mine maintenance, for a net favorable $10 million. |
| Lawson Winder | BofA Securities | US demand softness and San Ciprian economics | Oplinger saw no North American weakness; Beerman said the smelter's EBITDA fully covered the refinery's losses in the quarter, but the complex still consumes cash on CapEx and working capital. |
| Henry Hearle | B. Riley Securities | Massena East data-center sale and New York moratorium | On for Nick Giles; Oplinger said Alcoa and the developer are assessing the governor's executive order but are moving forward, with the transaction largely negotiated. |
Theme tracker
Themes are curator-classified across supplied calls.
| Theme | Status | Quarters mentioned | Read-through |
|---|---|---|---|
| San Ciprian restart and complex viability | persisted | Q3 2024, Q4 2024, Q1 2025, Q2 2025, Q3 2025, Q4 2025, Q1 2026, Q2 2026 | A multi-year overhang. The smelter restart, disrupted by a 2025 Spanish power outage, was completed in Q2 2026 and its EBITDA now covers refinery losses, but the site still burns cash and management holds to a cash-neutrality goal by end-2027. |
| Western Australia mine approvals | persisted | Q3 2024, Q4 2024, Q1 2025, Q2 2025, Q3 2025, Q4 2025, Q1 2026, Q2 2026 | The timeline has repeatedly moved: an original Q1 2026 target slipped to year-end 2026, and in Q2 2026 management said timing could extend further. Matters because it governs long-run bauxite grade and refinery feed. |
| Section 232 tariffs and Midwest premium | persisted | Q1 2025, Q2 2025, Q3 2025, Q4 2025, Q1 2026, Q2 2026 | Emerged as a central topic in early 2025 with the 50% tariff on Canadian metal. Management has consistently argued the Midwest premium passes the cost to US customers and has redirected roughly 30% of Canadian volume when netbacks favor other destinations. |
| Capital allocation: delevering versus shareholder returns | persisted | Q2 2024, Q3 2024, Q4 2024, Q2 2025, Q3 2025, Q4 2025, Q1 2026 | Recurring pressure on when buybacks resume. Alcoa reached its adjusted net-debt target range by end-2025, yet returns stayed limited to the regular dividend while management prioritized the balance sheet and, ultimately, the AliGroup acquisition. |
| Idle-site and data-center monetization | emerged | Q3 2025, Q4 2025, Q1 2026, Q2 2026 | First surfaced in 2025 as a value lever, with Massena East (a data-center project) furthest along toward the $500 million-$1 billion monetization target through 2030. |
| Gallium production project (Wagerup) | emerged | Q3 2025, Q4 2025, Q1 2026, Q2 2026 | Government-funded critical-minerals facility co-located at Wagerup; a final investment decision was reached in Q2 2026, with Alcoa's own contribution small. |
| CBAM (Europe carbon border mechanism) | dropped | Q3 2025, Q4 2025 | Discussed at length in late 2025 as a modest net positive to the Rotterdam premium, then largely absent from the Q1 and Q2 2026 calls as Middle East disruption took over the aluminum narrative. |
| South32 / AliGroup upstream acquisition | emerged | Q2 2026 | New this quarter and the dominant topic: a $4.1 billion cash-and-equity deal with a locked box, ticking fee and capped contingent value right, presented as accretive to EPS and cash flow at close. |
Guidance ledger
Quotes, calls, and speakers are source-verified; outcomes are curator-classified.
| Verbatim guidance | Call | Speaker | Curator outcome | Outcome note |
|---|---|---|---|---|
| “For the full year 2026 outlook, we expect alumina production to range between 9.7 million and 9.9 million tons and shipments to range between 11.8 million and 12.0 million tons.” | Alcoa Corporation, Q4 2025 Earnings Call, Jan 22, 2026 · 2026-01-22T22:00:00 | Molly Beerman | missed | Two quarters later, on the Q2 2026 call, Alcoa lowered the full-year alumina production range to 9.5-9.6 million and shipments to 11.5-11.6 million tons on Pinjarra refinery problems. |
| “Yes, that is our target, that we will have full run rate mid-'26 and trying to get to the level of profitability at the smelter in the back half of '26.” | Alcoa Corporation, Q3 2025 Earnings Call, Oct 22, 2025 · 2025-10-22T21:00:00 | Molly Beerman | kept | The San Ciprian smelter restart was completed in early Q2 2026; management reported the smelter's EBITDA covered refinery losses in that quarter. |
| “We continue to anticipate ministerial approvals by year-end 2026, consistent with the time line we've previously shared.” | Alcoa Corporation, Q1 2026 Earnings Call, Apr 16, 2026 · 2026-04-16T21:00:00 | William Oplinger | pending | On the Q2 2026 call, management said the approval timing could extend beyond the original year-end expectation, putting this target at risk though not yet resolved. |
| “Our capital expenditure estimate is $750 million, with $675 million in sustaining and $75 million in return seeking.” | Alcoa Corporation, Q4 2025 Earnings Call, Jan 22, 2026 · 2026-01-22T22:00:00 | Molly Beerman | pending | Full-year 2026 capital-spending plan; the year is not complete and later calls did not restate a revised total. |
| “We are lowering our full year alumina production and shipment expectations to 9.5 million metric tons to 9.6 million metric tons and 11.5 million metric tons to 11.6 million metric tons, respectively, due primarily to challenges at the Pinjarra Refinery during the second quarter.” | Alcoa Corporation, Q2 2026 Earnings Call, Jul 16, 2026 · 2026-07-16T21:00:00 | Molly Beerman | pending | The most recent full-year alumina guidance; outcome not yet observable in the supplied call history. |
| “So we're still targeting $500 million to $1 billion over the next – between now and 2030.” | Alcoa Corporation, Q2 2026 Earnings Call, Jul 16, 2026 · 2026-07-16T21:00:00 | William Oplinger | pending | Asset-monetization target through 2030, with the Massena East transaction described as substantially negotiated but not yet closed. |
Q&A pressure map
Question counts and firms are curator tallies; analyst coverage shown above.
| Topic | Questions | Firms | Pressure / response |
|---|---|---|---|
| Section 232 tariffs and Midwest premium on Canadian metal | 10 | Citigroup, UBS, Jefferies, JPMorgan, Wells Fargo Securities, Morgan Stanley, Barrenjoey | The most pressed topic across recent calls, peaking in Q2 2025 when several analysts worked through the tariff math. Management repeatedly held that the Midwest premium ultimately passes the cost to US customers and that it will redirect Canadian tons when netbacks favor other markets. |
| Capital allocation and timing of shareholder returns | 6 | Jefferies, BofA Securities, Wells Fargo Securities, B. Riley Securities, Barrenjoey | Analysts pressed repeatedly on when buybacks would resume as net debt fell into the target range. Management consistently deferred, prioritizing a fortress balance sheet and growth optionality over incremental returns. |
| San Ciprian refinery cash burn and profitability | 5 | UBS, BMO Capital Markets, BofA Securities | Recurring questions on whether the smelter can offset refinery losses. Management held to smelter profitability post-restart and a complex-level cash-neutrality goal by end-2027, while conceding the refinery stays challenged at current prices. |
| Western Australia mine-approval timeline | 5 | Barrenjoey, JPMorgan | Analysts probed for red flags and slippage. Management moved from an unchanged-timeline message toward acknowledging in Q2 2026 that approvals could extend beyond year-end 2026. |
| Warrick fourth-line restart economics | 3 | B. Riley Securities, Wells Fargo Securities | Given a tight market, analysts asked why the idle Warrick line stays down. Management gave a consistent answer: roughly $100 million and one to two years, and it will not commit capital on the basis of a tariff that could change. |
Language shifts
Only language evidence verified against the referenced component is shown.
| Observation | Verbatim evidence | Call ID | Component |
|---|---|---|---|
| Management introduced explicit slippage caution on the Western Australia approvals after quarters of an 'unchanged timeline' message. | “while my confidence in the outcome remains unchanged, the timing could extend beyond our original expectations.” | 2006225987 | 36 |
| A rare acknowledgment of a consensus miss, breaking from the recent run of unqualified 'strong quarter' framing. | “While our reported results were modestly below consensus, the variance was driven by lower-than-expected aluminum price realization late in the quarter as LME prices declined sharply in the final 2 weeks of June.” | 2006225987 | 3 |
| New operational-risk vocabulary around Pinjarra, in contrast to the usual 'stable and reliable' refrain for the refining system. | “operational instability experienced during the quarter” | 2006225987 | 3 |
| Management leaned on 'sentiment' to explain the aluminum price retreat while insisting the underlying case is intact. | “While LME has returned to pre-Middle East conflict levels following a macro-driven correction, aluminum fundamentals remain strong.” | 2006225987 | 4 |
| The strategic frame shifted from balance-sheet discipline and no greenfield growth toward large-scale M&A. | “Last and most importantly, we announced the largest transaction for Alcoa Corporation.” | 2006225987 | 2 |
The call history shows a company that spent three years working through internal turnarounds – San Ciprian, Alumar, Kwinana and the Australian mine approvals – and is now pivoting to its largest-ever acquisition even as it concedes a rare consensus miss and trims near-term alumina guidance. The long-running question of when balance-sheet discipline converts into shareholder returns now sits alongside a $4.1 billion deal that will absorb much of that capacity.